 3
3peptides
spectra
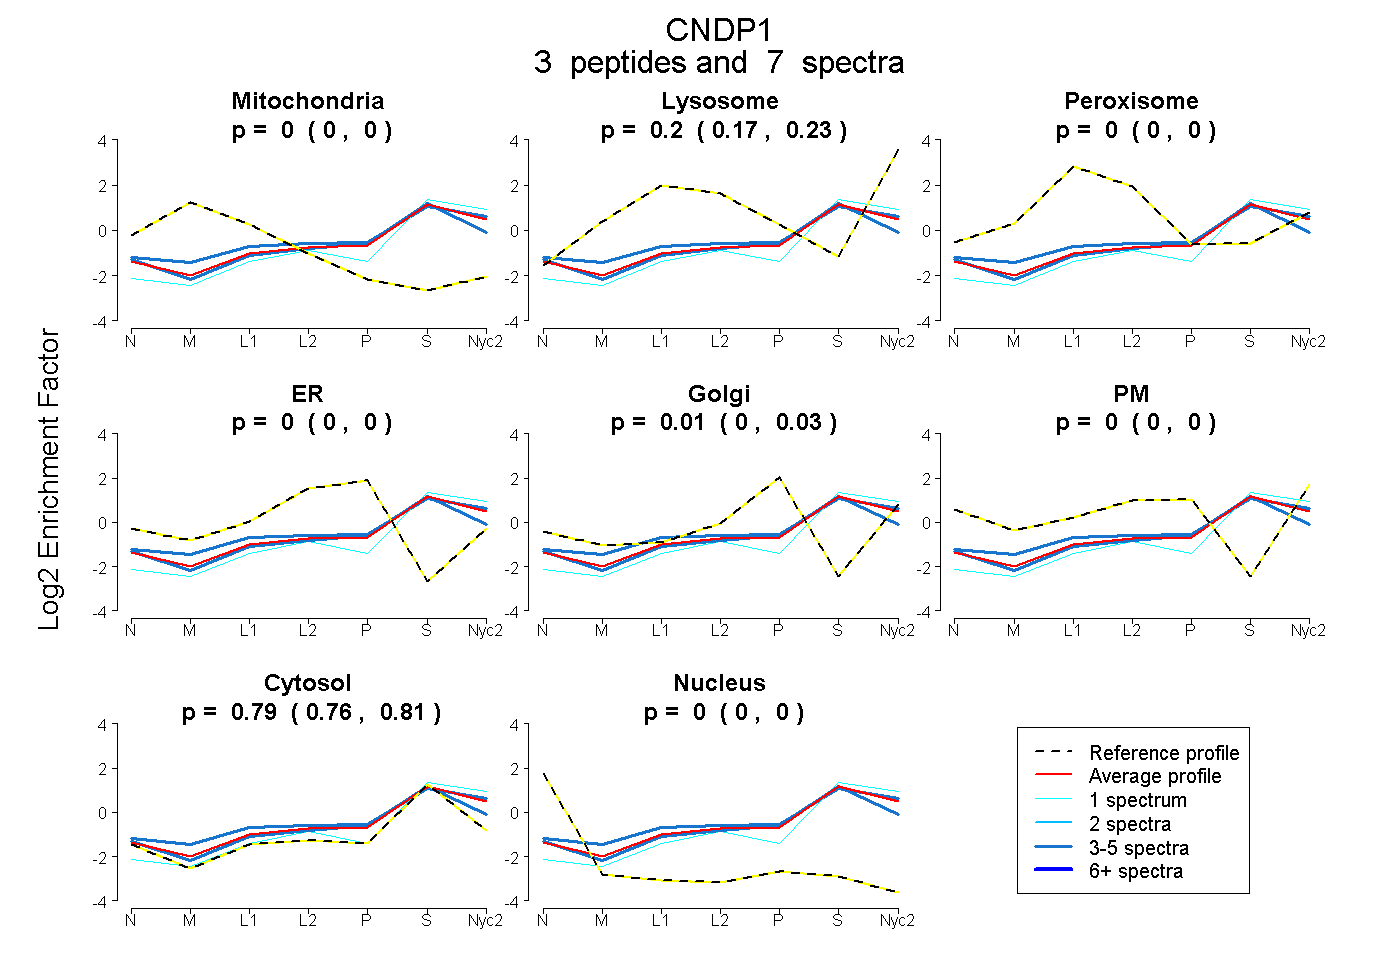
0.000 | 0.000
0.171 | 0.227
0.000 | 0.000
0.000 | 0.000
0.000 | 0.032
0.000 | 0.000
0.763 | 0.805
0.000 | 0.000
| Plot | Mito | Lyso | Perox | ER | Golgi | PM | Cytosol | Nucleus | |||||
| Expt A |
3 peptides |
7 spectra |
|
0.000 0.000 | 0.000 |
0.205 0.171 | 0.227 |
0.000 0.000 | 0.000 |
0.000 0.000 | 0.000 |
0.008 0.000 | 0.032 |
0.000 0.000 | 0.000 |
0.787 0.763 | 0.805 |
0.000 0.000 | 0.000 |
| 3 spectra, KPALTCGTR | 0.000 | 0.111 | 0.000 | 0.000 | 0.068 | 0.000 | 0.822 | 0.000 | ||
| 3 spectra, EELLTHLWR | 0.000 | 0.276 | 0.000 | 0.000 | 0.015 | 0.000 | 0.709 | 0.000 | ||
| 1 spectrum, FLFDTK | 0.000 | 0.162 | 0.000 | 0.000 | 0.000 | 0.000 | 0.838 | 0.000 |
| Plot | Lyso | Other | |||||||||||
| Expt C |
2 peptides |
2 spectra |
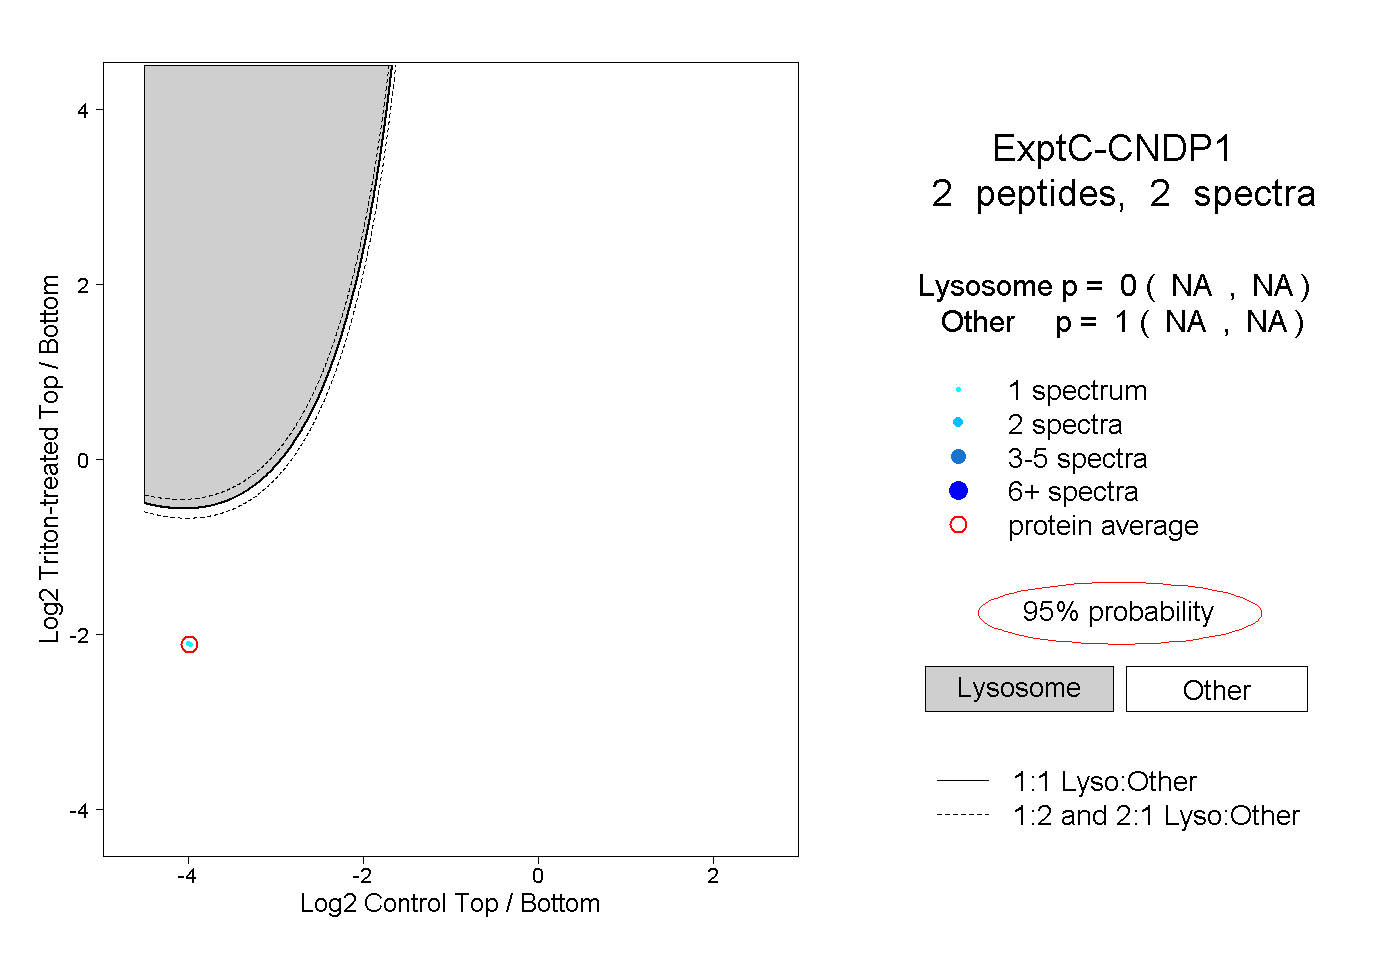 |
0.000 NA | NA |
1.000 NA | NA |