 4
4peptides
spectra
0.000 | 0.046
0.000 | 0.000
0.000 | 0.045
0.000 | 0.060
0.000 | 0.000
0.664 | 0.780
0.123 | 0.239
0.001 | 0.074
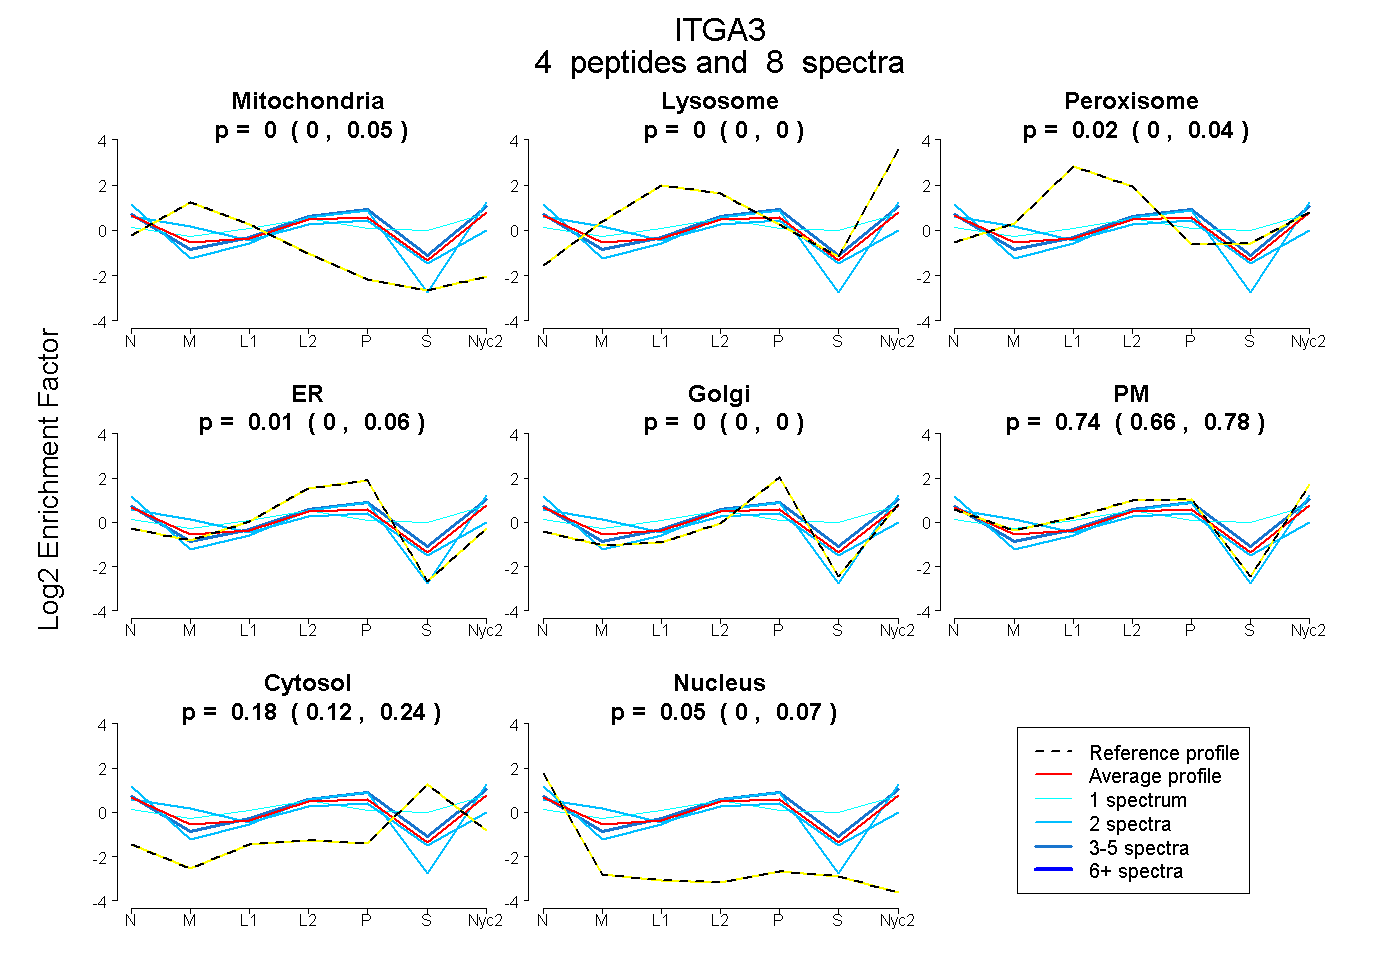
| Plot | Mito | Lyso | Perox | ER | Golgi | PM | Cytosol | Nucleus | |||||
| Expt A |
4 peptides |
8 spectra |
|
0.000 0.000 | 0.046 |
0.000 0.000 | 0.000 |
0.024 0.000 | 0.045 |
0.006 0.000 | 0.060 |
0.000 0.000 | 0.000 |
0.739 0.664 | 0.780 |
0.184 0.123 | 0.239 |
0.047 0.001 | 0.074 |