 1
1peptide
spectra
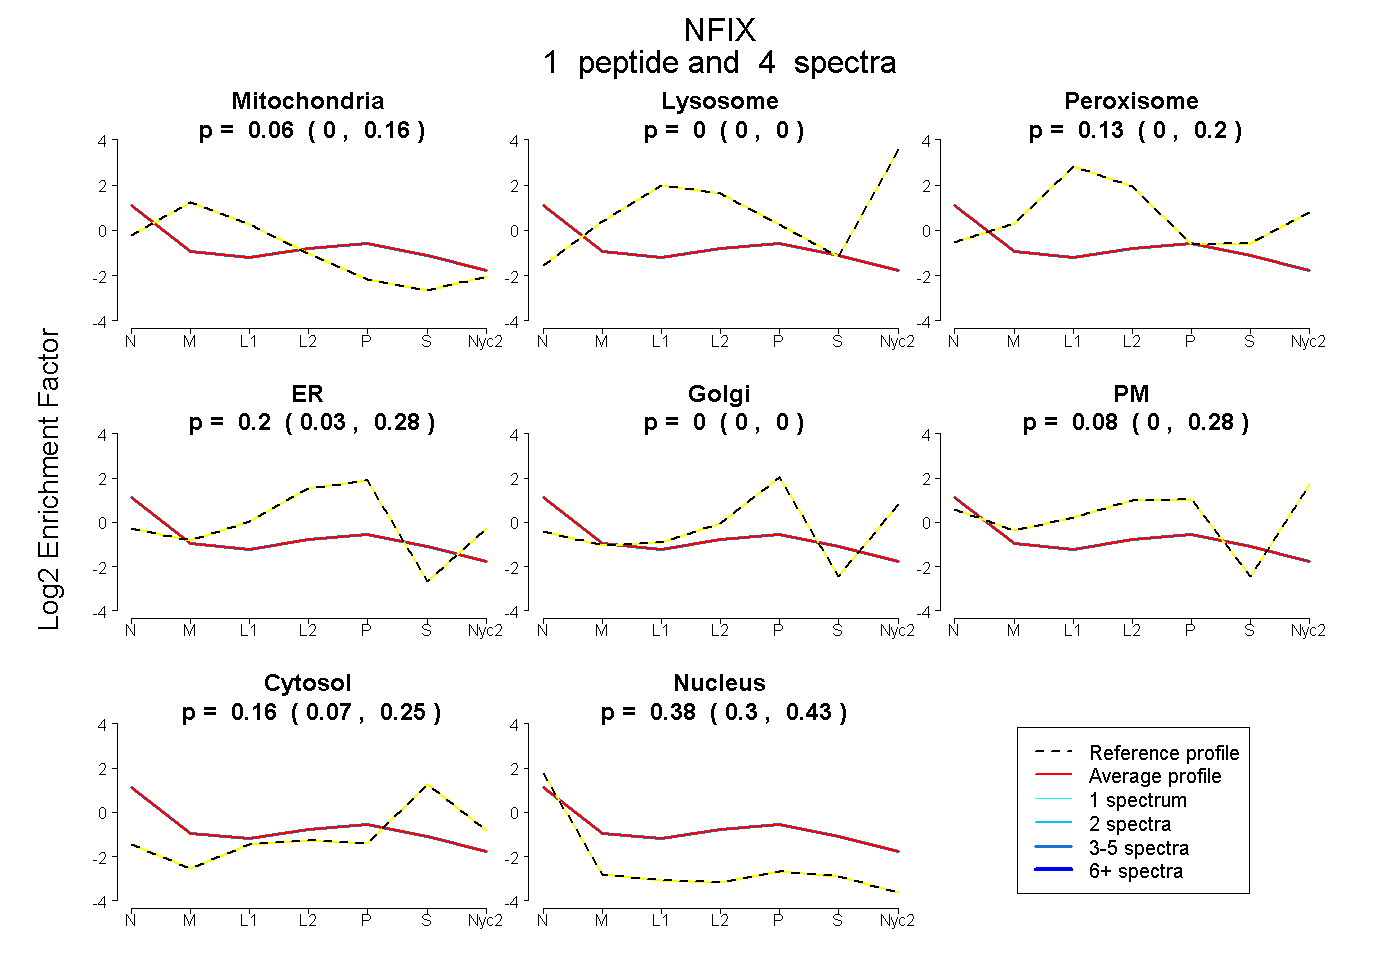
0.000 | 0.156
0.000 | 0.000
0.001 | 0.202
0.033 | 0.276
0.000 | 0.000
0.000 | 0.280
0.071 | 0.249
0.296 | 0.429
| Plot | Mito | Lyso | Perox | ER | Golgi | PM | Cytosol | Nucleus | |||||
| Expt A |
1 peptide |
4 spectra |
|
0.061 0.000 | 0.156 |
0.000 0.000 | 0.000 |
0.128 0.001 | 0.202 |
0.195 0.033 | 0.276 |
0.000 0.000 | 0.000 |
0.081 0.000 | 0.280 |
0.159 0.071 | 0.249 |
0.376 0.296 | 0.429 |
| 4 spectra, DIRPEFR | 0.061 | 0.000 | 0.128 | 0.195 | 0.000 | 0.081 | 0.159 | 0.376 |
| Plot | Lyso | Other | |||||||||||
| Expt C |
3 peptides |
8 spectra |
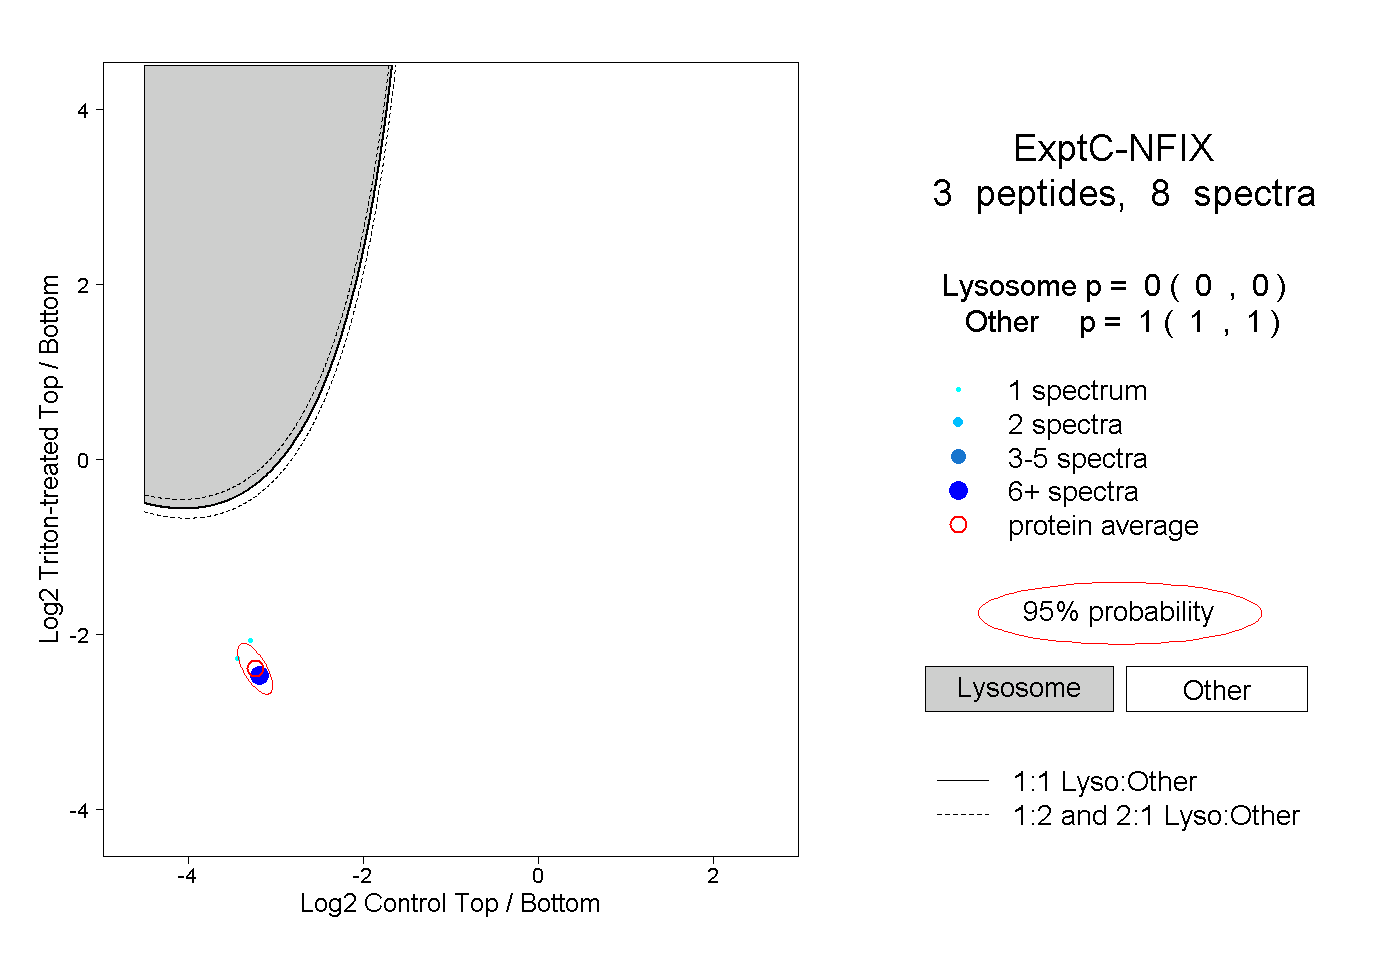 |
0.000 0.000 | 0.000 |
1.000 1.000 | 1.000 |