7
7peptides
spectra
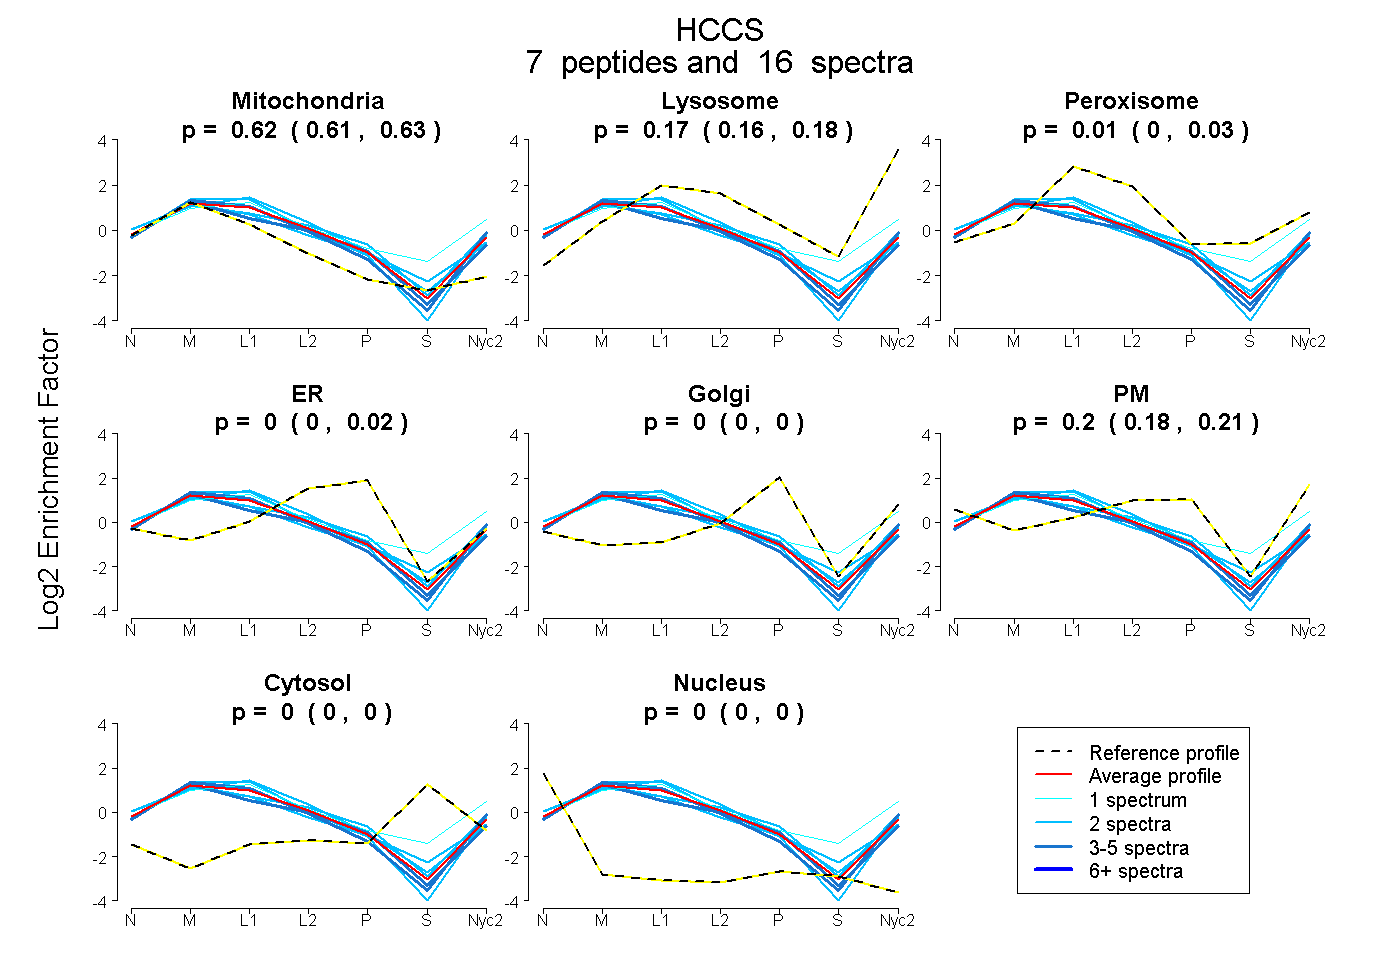
0.607 | 0.627
0.155 | 0.183
0.000 | 0.032
0.000 | 0.017
0.000 | 0.000
0.179 | 0.213
0.000 | 0.000
0.000 | 0.000
3peptides
spectra
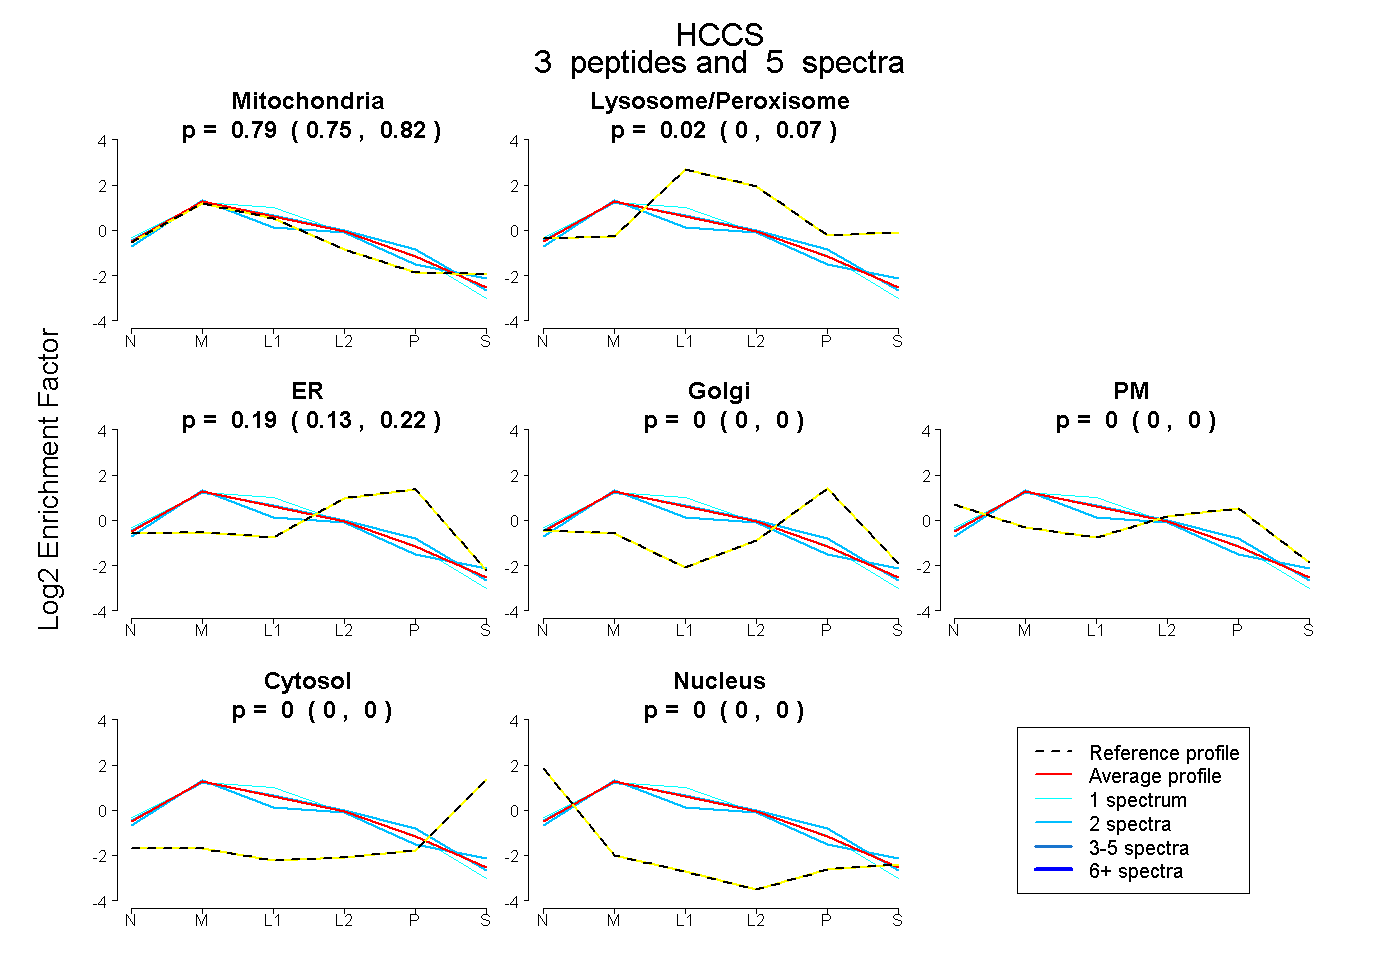
0.752 | 0.818
0.000 | 0.067
0.133 | 0.224
0.000 | 0.000
0.000 | 0.000
0.000 | 0.000
0.000 | 0.000