 7
7peptides
spectra
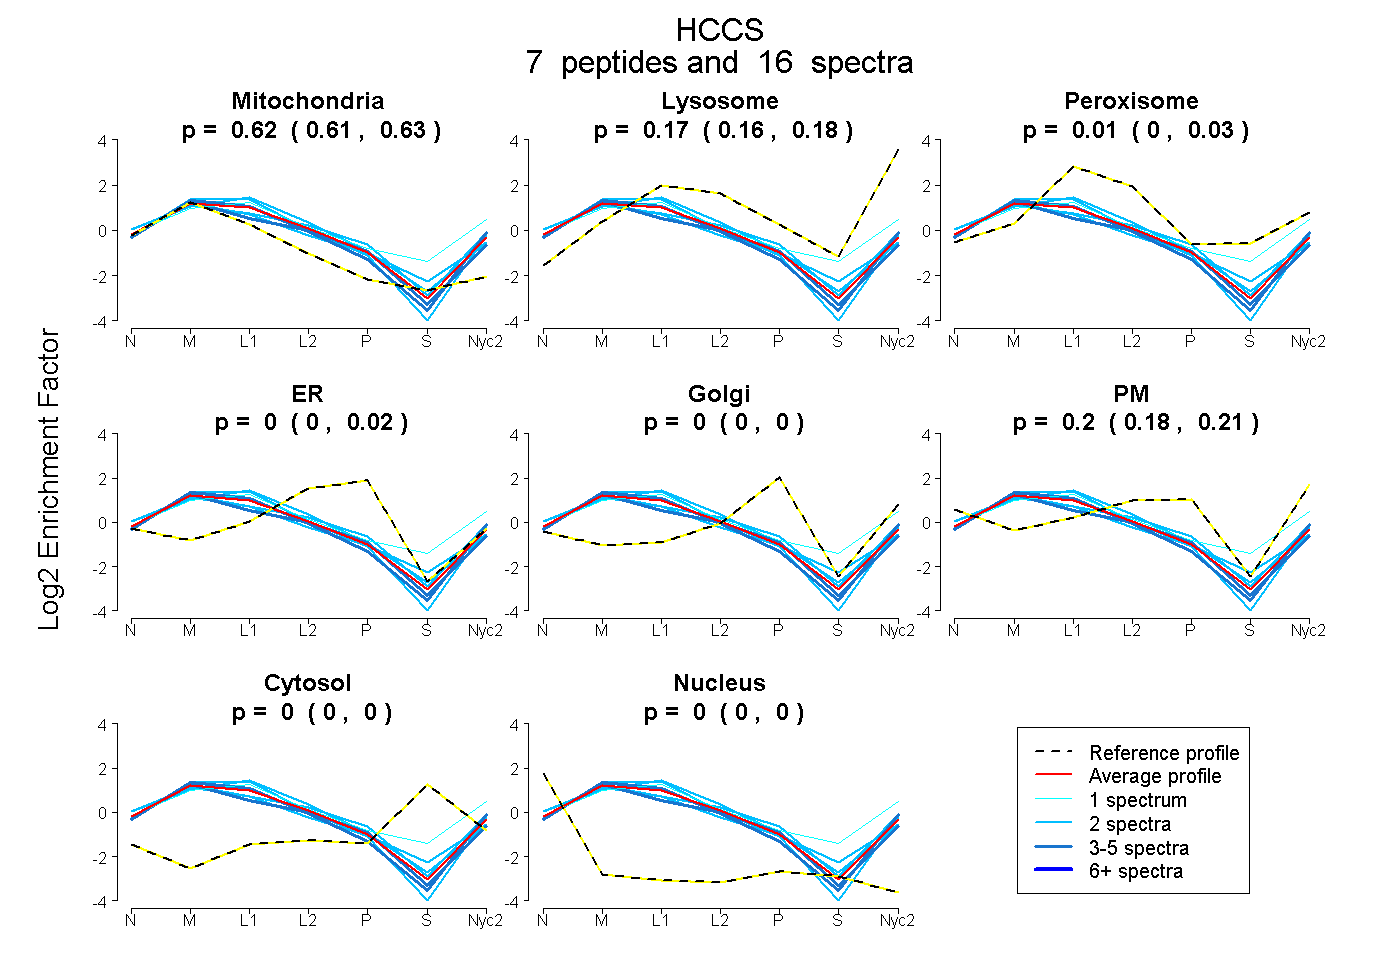
0.607 | 0.627
0.155 | 0.183
0.000 | 0.032
0.000 | 0.017
0.000 | 0.000
0.179 | 0.213
0.000 | 0.000
0.000 | 0.000
| Plot | Mito | Lyso | Perox | ER | Golgi | PM | Cytosol | Nucleus | |||||
| Expt A |
7 peptides |
16 spectra |
|
0.619 0.607 | 0.627 |
0.170 0.155 | 0.183 |
0.011 0.000 | 0.032 |
0.000 0.000 | 0.017 |
0.000 0.000 | 0.000 |
0.201 0.179 | 0.213 |
0.000 0.000 | 0.000 |
0.000 0.000 | 0.000 |
| 2 spectra, DMYNIIR | 0.656 | 0.156 | 0.043 | 0.000 | 0.000 | 0.145 | 0.000 | 0.000 | ||
| 2 spectra, AYEYVECPVTGAAAK | 0.523 | 0.000 | 0.275 | 0.012 | 0.000 | 0.190 | 0.000 | 0.000 | ||
| 2 spectra, AHSVPAHQDR | 0.643 | 0.179 | 0.000 | 0.000 | 0.000 | 0.179 | 0.000 | 0.000 | ||
| 1 spectrum, YVIDYYDGGEVNK | 0.423 | 0.235 | 0.221 | 0.000 | 0.000 | 0.113 | 0.009 | 0.000 | ||
| 3 spectra, SWMGYELPFDR | 0.653 | 0.209 | 0.000 | 0.000 | 0.000 | 0.138 | 0.000 | 0.000 | ||
| 2 spectra, EESSIPR | 0.533 | 0.111 | 0.008 | 0.000 | 0.000 | 0.349 | 0.000 | 0.000 | ||
| 4 spectra, HDWIINR | 0.649 | 0.082 | 0.000 | 0.087 | 0.000 | 0.181 | 0.000 | 0.000 |
| Plot | Mito | Lyso or Perox | ER | Golgi | PM | Cytosol | Nucleus | ||||||
| Expt B |
3 peptides |
5 spectra |
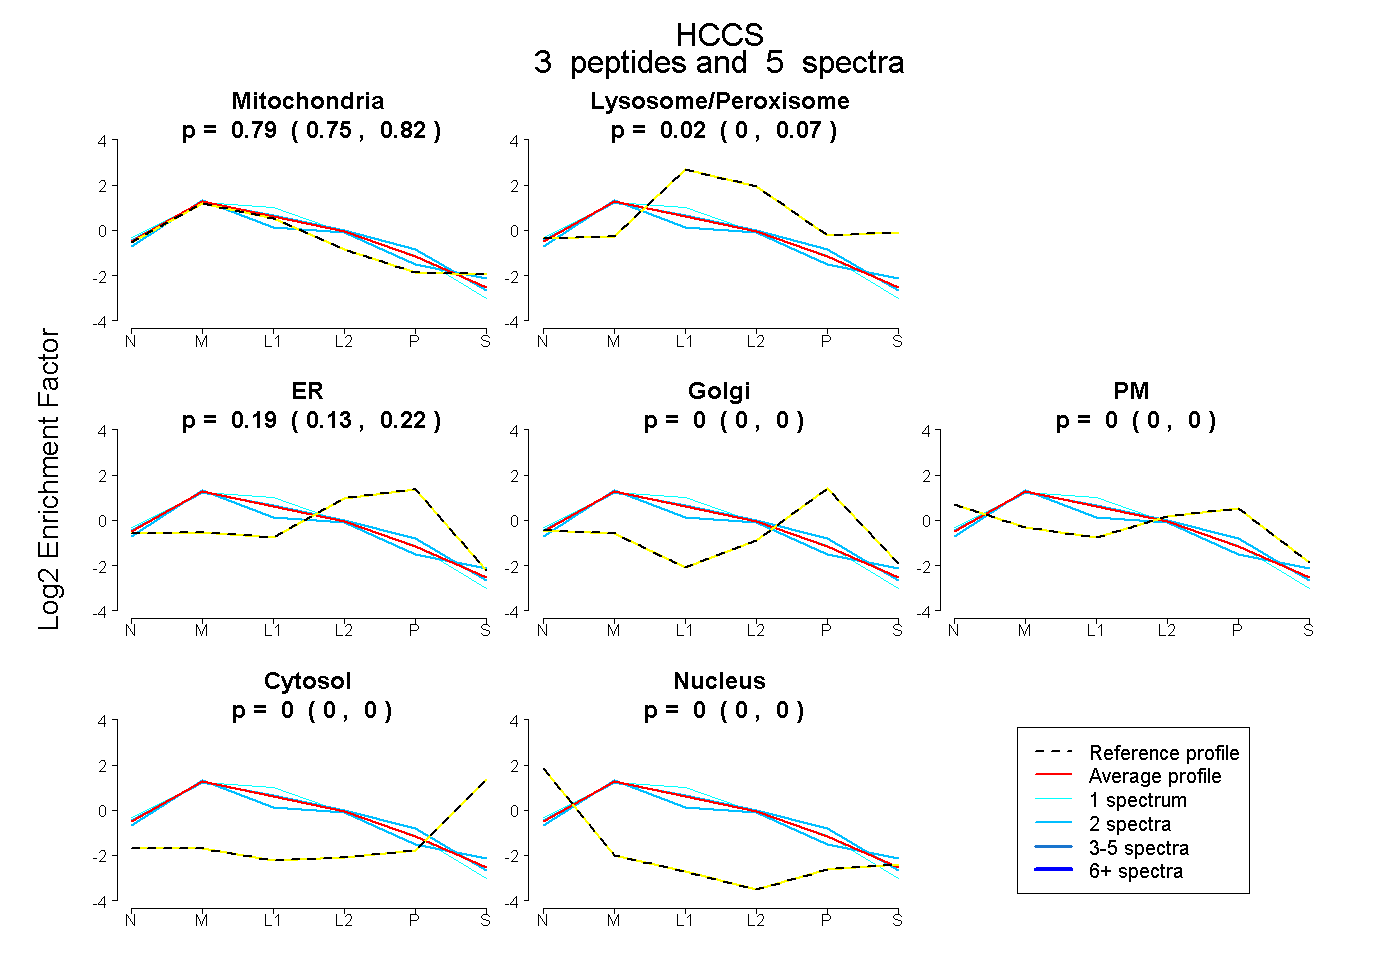 |
0.790 0.752 | 0.818 |
0.024 0.000 | 0.067 |
0.186 0.133 | 0.224 |
0.000 0.000 | 0.000 |
0.000 0.000 | 0.000 |
0.000 0.000 | 0.000 |
0.000 0.000 | 0.000 |
|||
| Plot | Lyso | Other | |||||||||||
| Expt C |
9 peptides |
45 spectra |
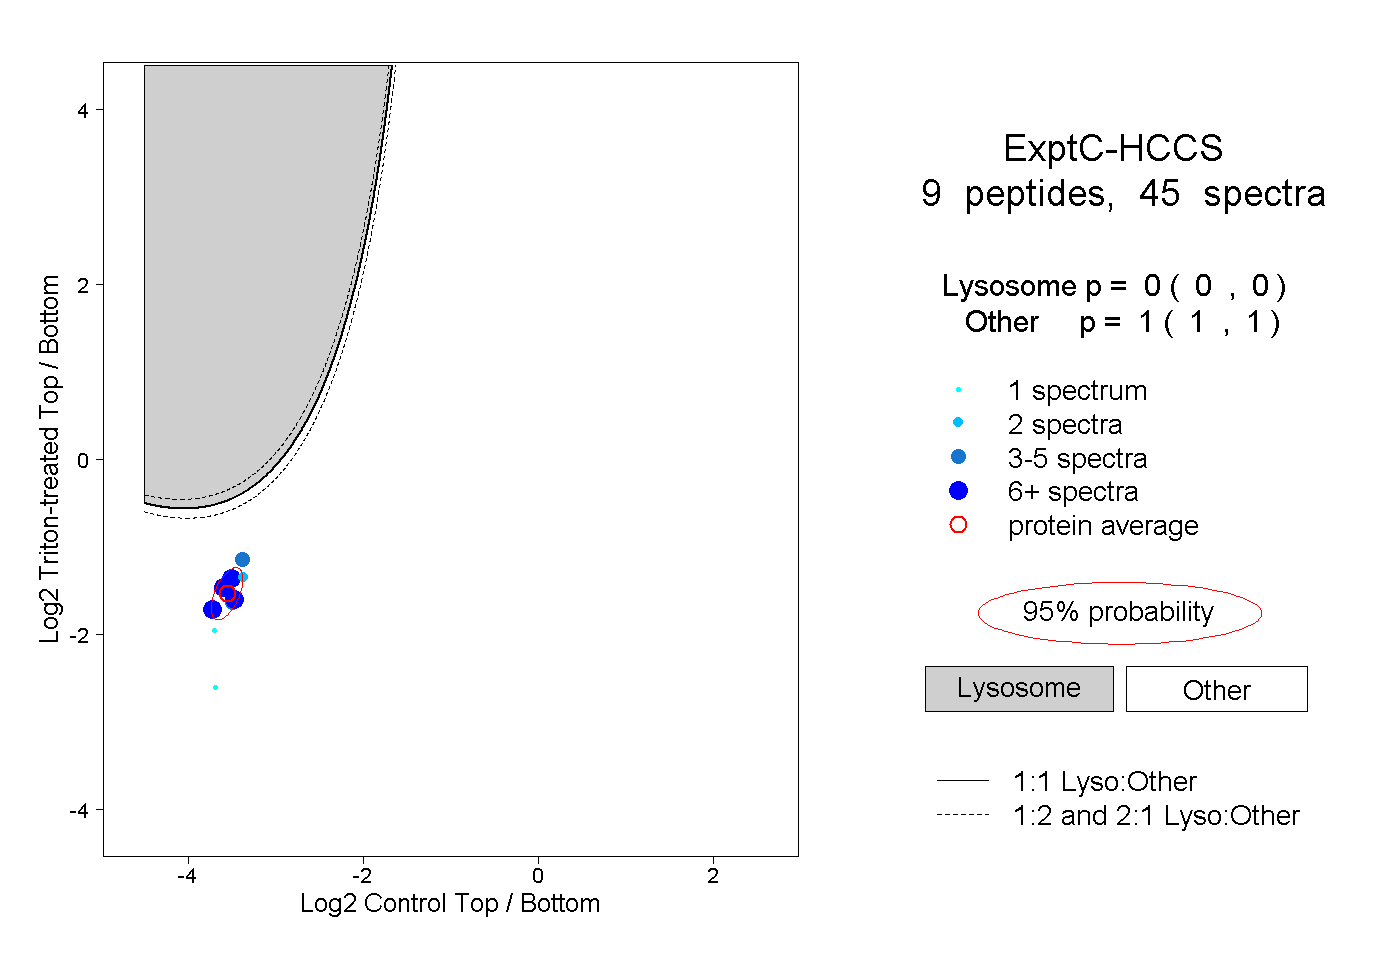 |
0.000 0.000 | 0.000 |
1.000 1.000 | 1.000 |
||||||||
| Plot | Lyso | Other | |||||||||||
| Expt D |
3 peptides |
6 spectra |
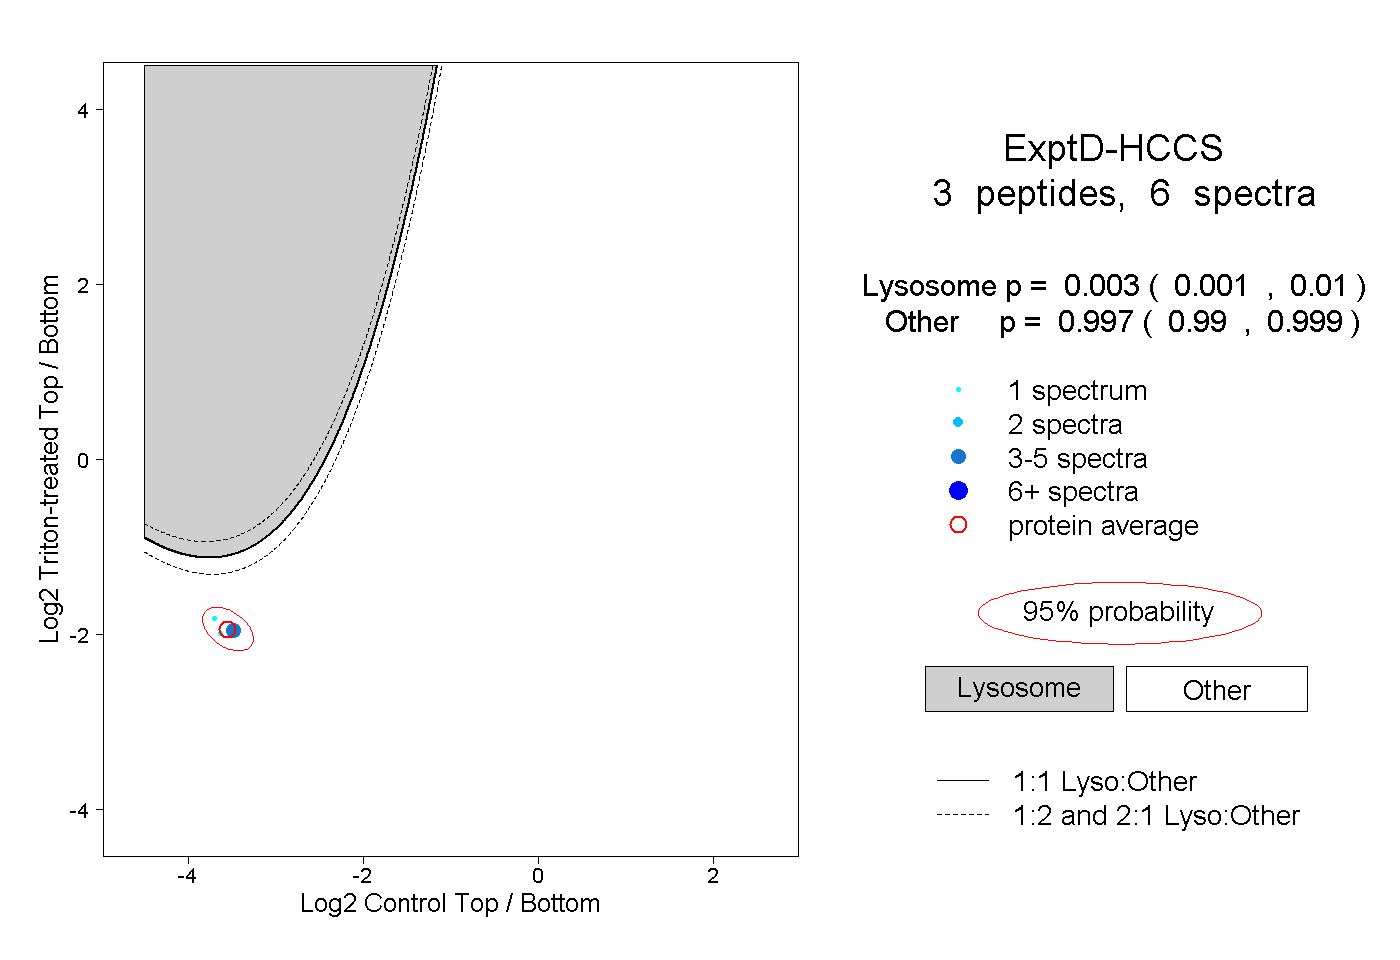 |
0.003 0.001 | 0.010 |
0.997 0.990 | 0.999 |