 2
2peptides
spectra
0.000 | 0.098
0.000 | 0.000
0.000 | 0.069
0.688 | 0.823
0.000 | 0.000
0.000 | 0.000
0.000 | 0.179
0.028 | 0.168
1peptide
spectra
NA | NA
NA | NA
NA | NA
NA | NA
NA | NA
NA | NA
NA | NA
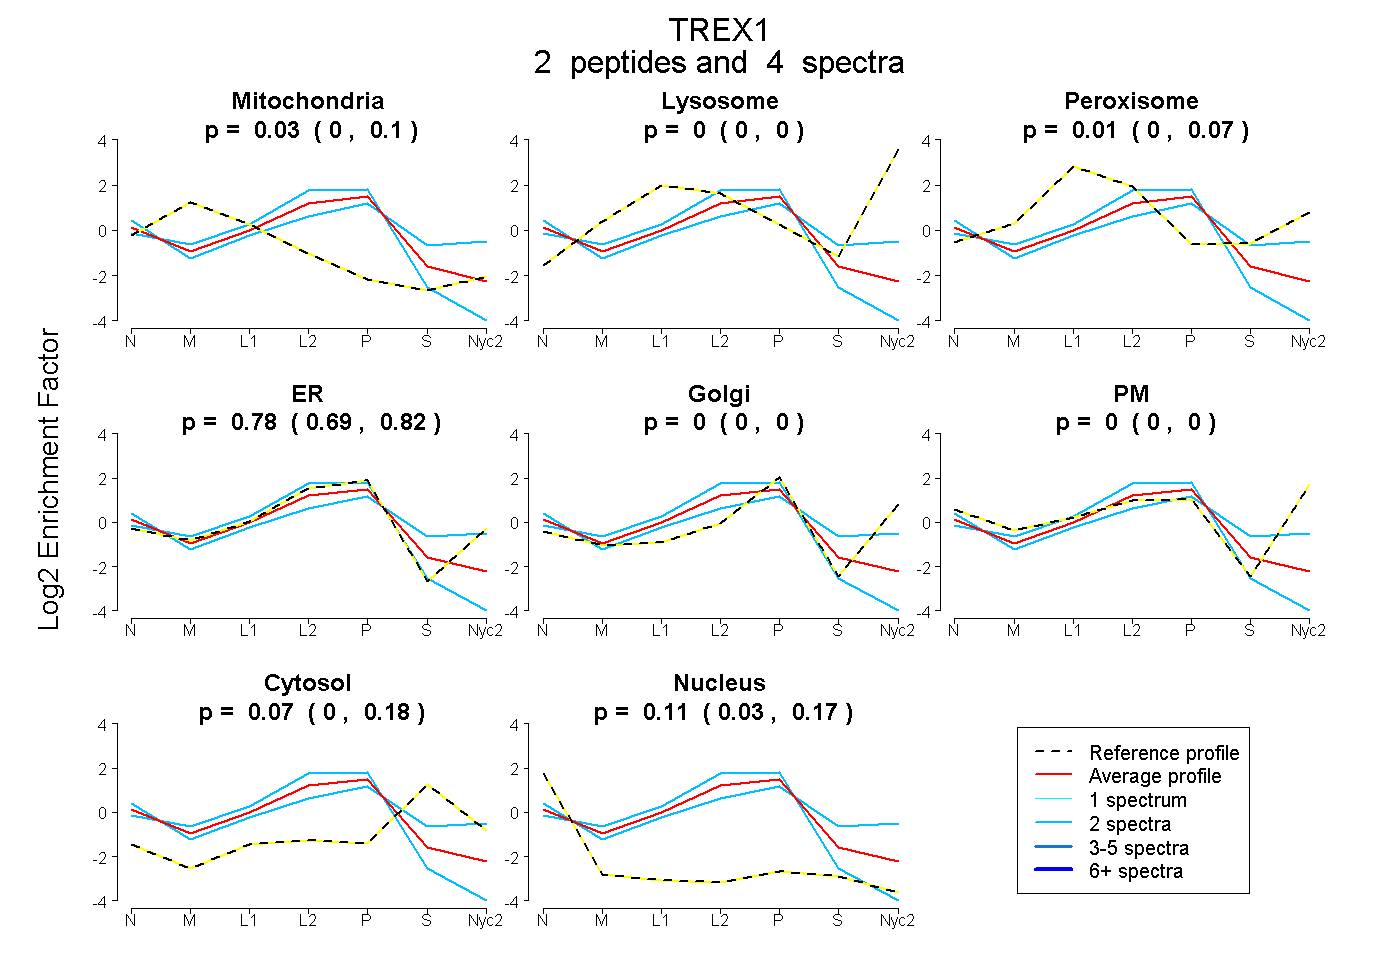
| Plot | Mito | Lyso | Perox | ER | Golgi | PM | Cytosol | Nucleus | |||||
| Expt A |
2 peptides |
4 spectra |
|
0.032 0.000 | 0.098 |
0.000 0.000 | 0.000 |
0.013 0.000 | 0.069 |
0.775 0.688 | 0.823 |
0.000 0.000 | 0.000 |
0.000 0.000 | 0.000 |
0.074 0.000 | 0.179 |
0.107 0.028 | 0.168 |
||
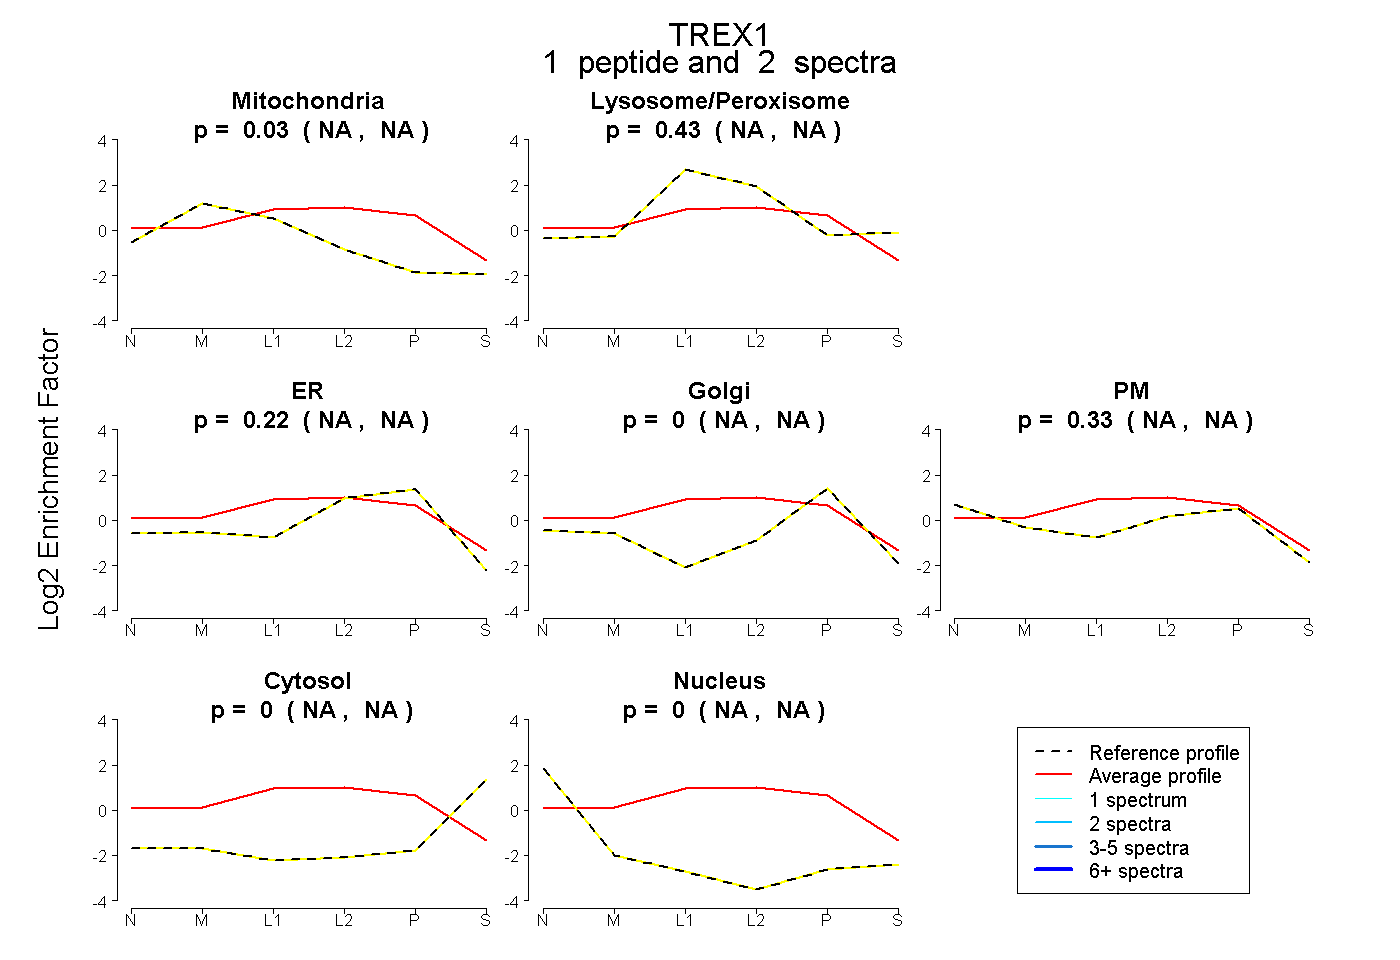
| Plot | Mito | Lyso or Perox | ER | Golgi | PM | Cytosol | Nucleus | ||||||
| Expt B |
1 peptide |
2 spectra |
|
0.031 NA | NA |
0.426 NA | NA |
0.215 NA | NA |
0.000 NA | NA |
0.328 NA | NA |
0.000 NA | NA |
0.000 NA | NA |