16
16peptides
spectra
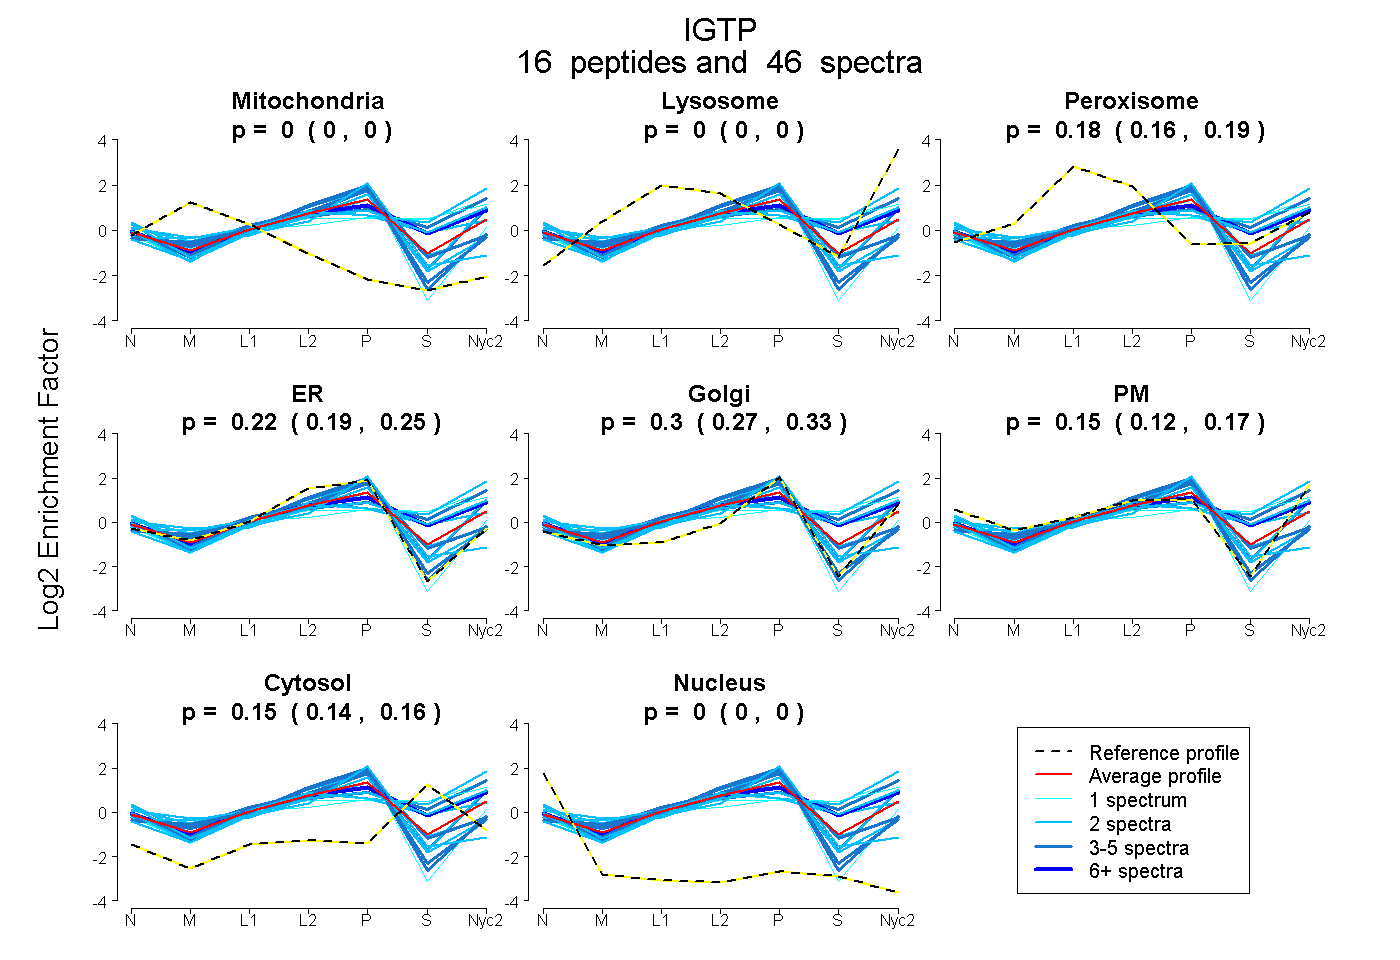
0.000 | 0.000
0.000 | 0.000
0.162 | 0.185
0.195 | 0.250
0.272 | 0.325
0.121 | 0.166
0.143 | 0.162
0.000 | 0.000
12peptides
spectra
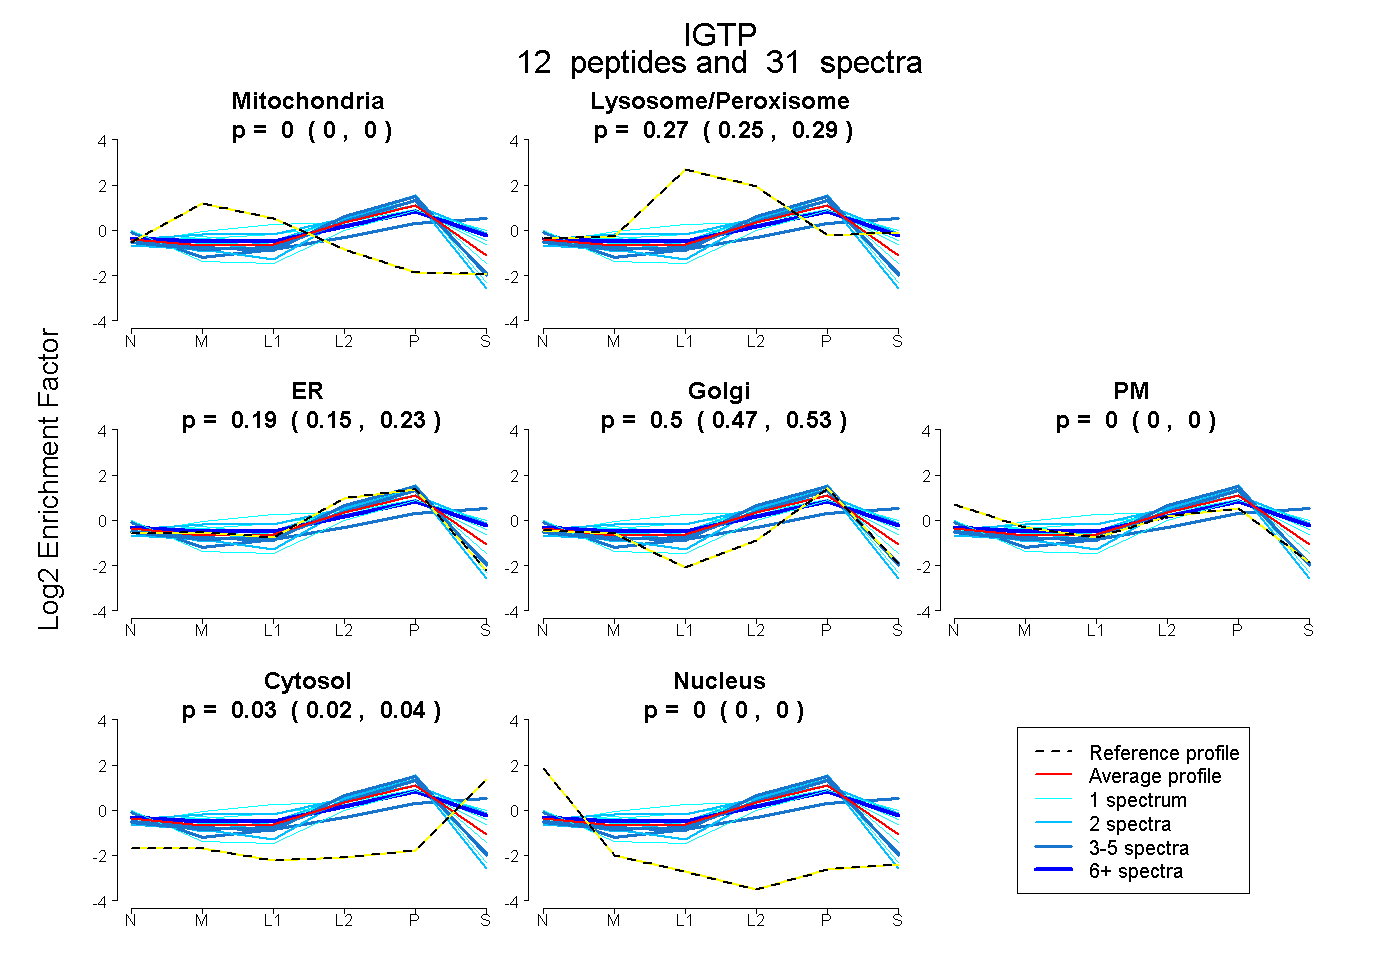
0.000 | 0.000
0.252 | 0.286
0.154 | 0.226
0.474 | 0.528
0.000 | 0.000
0.019 | 0.043
0.000 | 0.000