 16
16peptides
spectra
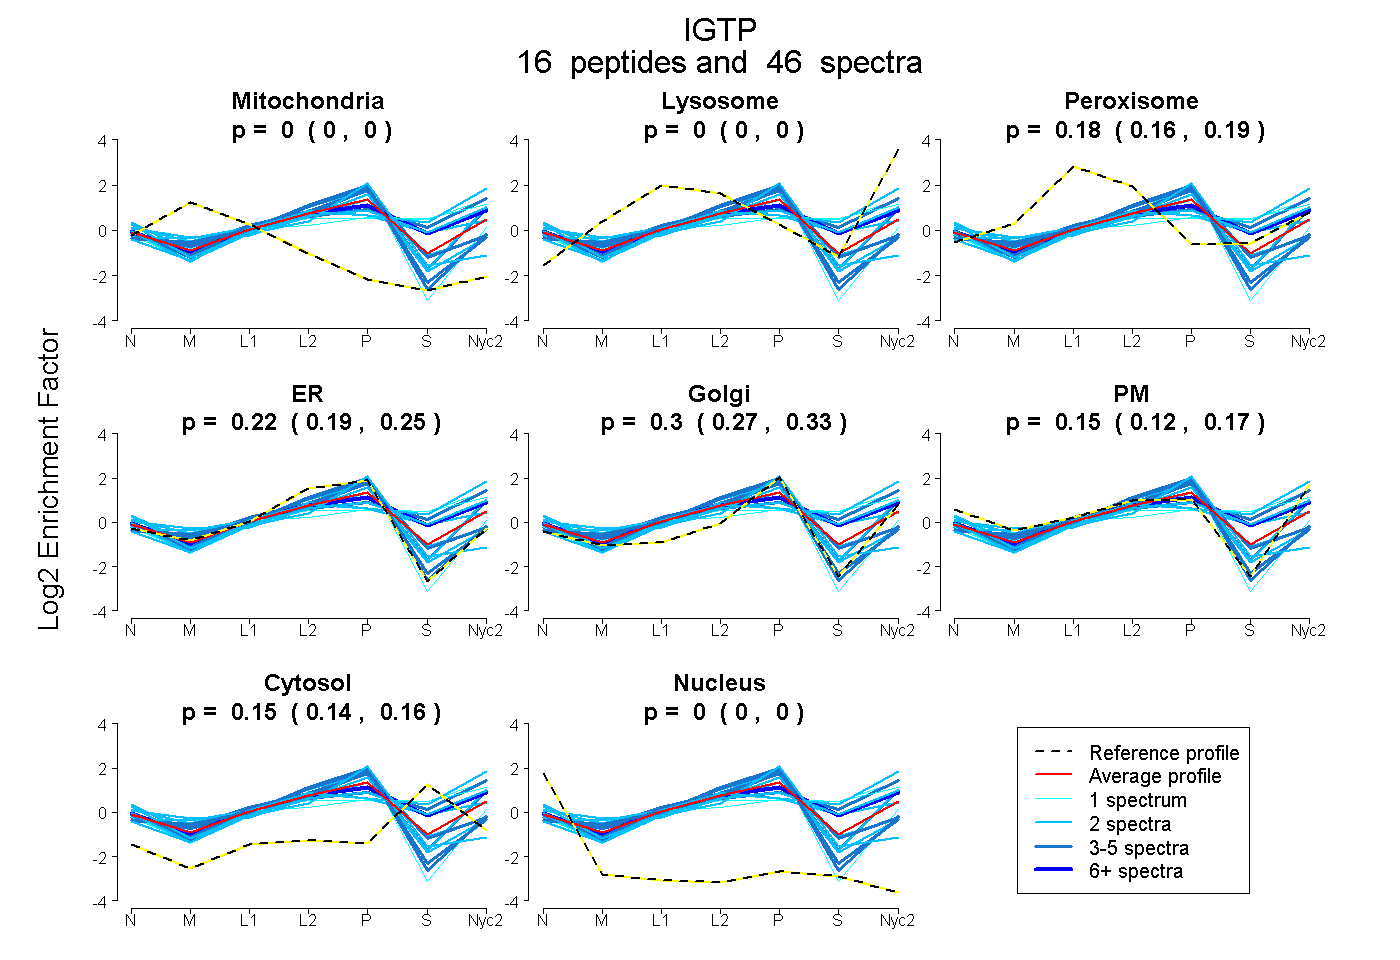
0.000 | 0.000
0.000 | 0.000
0.162 | 0.185
0.195 | 0.250
0.272 | 0.325
0.121 | 0.166
0.143 | 0.162
0.000 | 0.000
| Plot | Mito | Lyso | Perox | ER | Golgi | PM | Cytosol | Nucleus | |||||
| Expt A |
16 peptides |
46 spectra |
|
0.000 0.000 | 0.000 |
0.000 0.000 | 0.000 |
0.175 0.162 | 0.185 |
0.225 0.195 | 0.250 |
0.301 0.272 | 0.325 |
0.145 0.121 | 0.166 |
0.154 0.143 | 0.162 |
0.000 0.000 | 0.000 |
| 1 spectrum, DNSILSVEVIK | 0.000 | 0.247 | 0.014 | 0.000 | 0.000 | 0.322 | 0.417 | 0.000 | ||
| 4 spectra, EDLMFTK | 0.000 | 0.066 | 0.153 | 0.174 | 0.490 | 0.117 | 0.000 | 0.000 | ||
| 2 spectra, LAEAMQR | 0.104 | 0.000 | 0.046 | 0.511 | 0.286 | 0.005 | 0.048 | 0.000 | ||
| 2 spectra, ALQFQDLIK | 0.000 | 0.000 | 0.198 | 0.436 | 0.211 | 0.000 | 0.137 | 0.019 | ||
| 2 spectra, VIYTVK | 0.000 | 0.000 | 0.000 | 0.753 | 0.031 | 0.000 | 0.189 | 0.027 | ||
| 2 spectra, VFQEIFGVDDQSLSQVSR | 0.000 | 0.311 | 0.000 | 0.000 | 0.000 | 0.337 | 0.352 | 0.000 | ||
| 10 spectra, LIGHEEEDSAPTGVVR | 0.000 | 0.066 | 0.181 | 0.049 | 0.203 | 0.252 | 0.249 | 0.000 | ||
| 4 spectra, IIDENNLQR | 0.000 | 0.207 | 0.000 | 0.000 | 0.002 | 0.445 | 0.346 | 0.000 | ||
| 4 spectra, VAQSTGRPEMSTR | 0.034 | 0.006 | 0.000 | 0.803 | 0.157 | 0.000 | 0.000 | 0.000 | ||
| 3 spectra, LFGVDNESLR | 0.026 | 0.000 | 0.003 | 0.807 | 0.131 | 0.000 | 0.032 | 0.000 | ||
| 4 spectra, SLDTYQK | 0.000 | 0.000 | 0.098 | 0.566 | 0.175 | 0.000 | 0.161 | 0.000 | ||
| 1 spectrum, DIHNIR | 0.000 | 0.000 | 0.000 | 0.719 | 0.210 | 0.071 | 0.000 | 0.000 | ||
| 1 spectrum, SMEKPDTHYK | 0.000 | 0.209 | 0.034 | 0.000 | 0.000 | 0.314 | 0.444 | 0.000 | ||
| 2 spectra, HLEAAVSPPYDIADLER | 0.000 | 0.000 | 0.147 | 0.123 | 0.000 | 0.403 | 0.326 | 0.000 | ||
| 2 spectra, FYVVWTK | 0.000 | 0.182 | 0.061 | 0.307 | 0.382 | 0.068 | 0.000 | 0.000 | ||
| 2 spectra, STFINALR | 0.000 | 0.029 | 0.075 | 0.002 | 0.000 | 0.564 | 0.331 | 0.000 |
| Plot | Mito | Lyso or Perox | ER | Golgi | PM | Cytosol | Nucleus | ||||||
| Expt B |
12 peptides |
31 spectra |
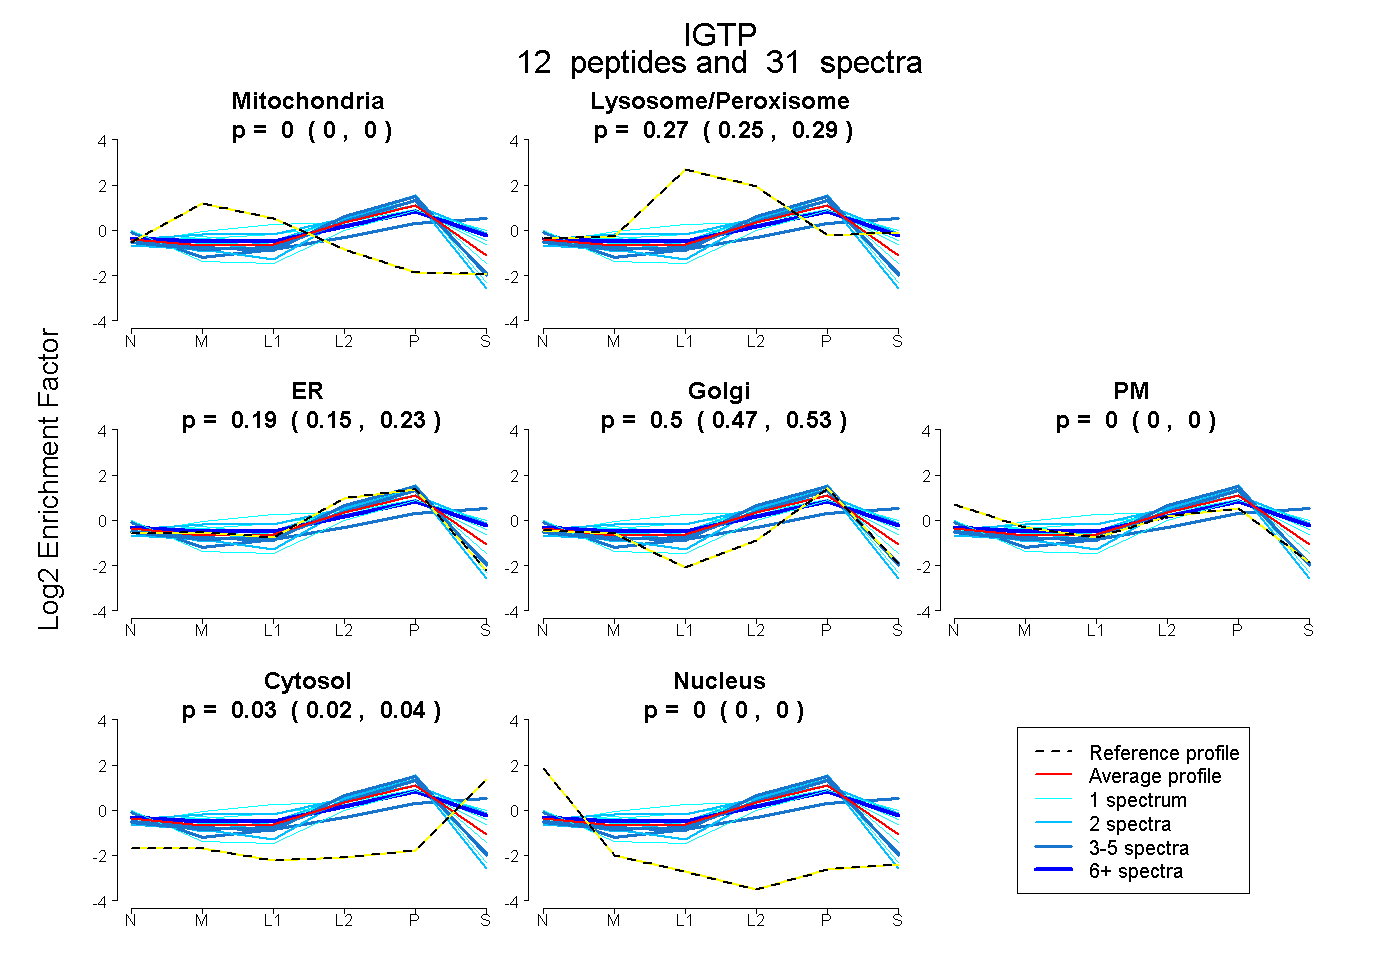 |
0.000 0.000 | 0.000 |
0.271 0.252 | 0.286 |
0.193 0.154 | 0.226 |
0.504 0.474 | 0.528 |
0.000 0.000 | 0.000 |
0.032 0.019 | 0.043 |
0.000 0.000 | 0.000 |
|||
| Plot | Lyso | Other | |||||||||||
| Expt C |
25 peptides |
125 spectra |
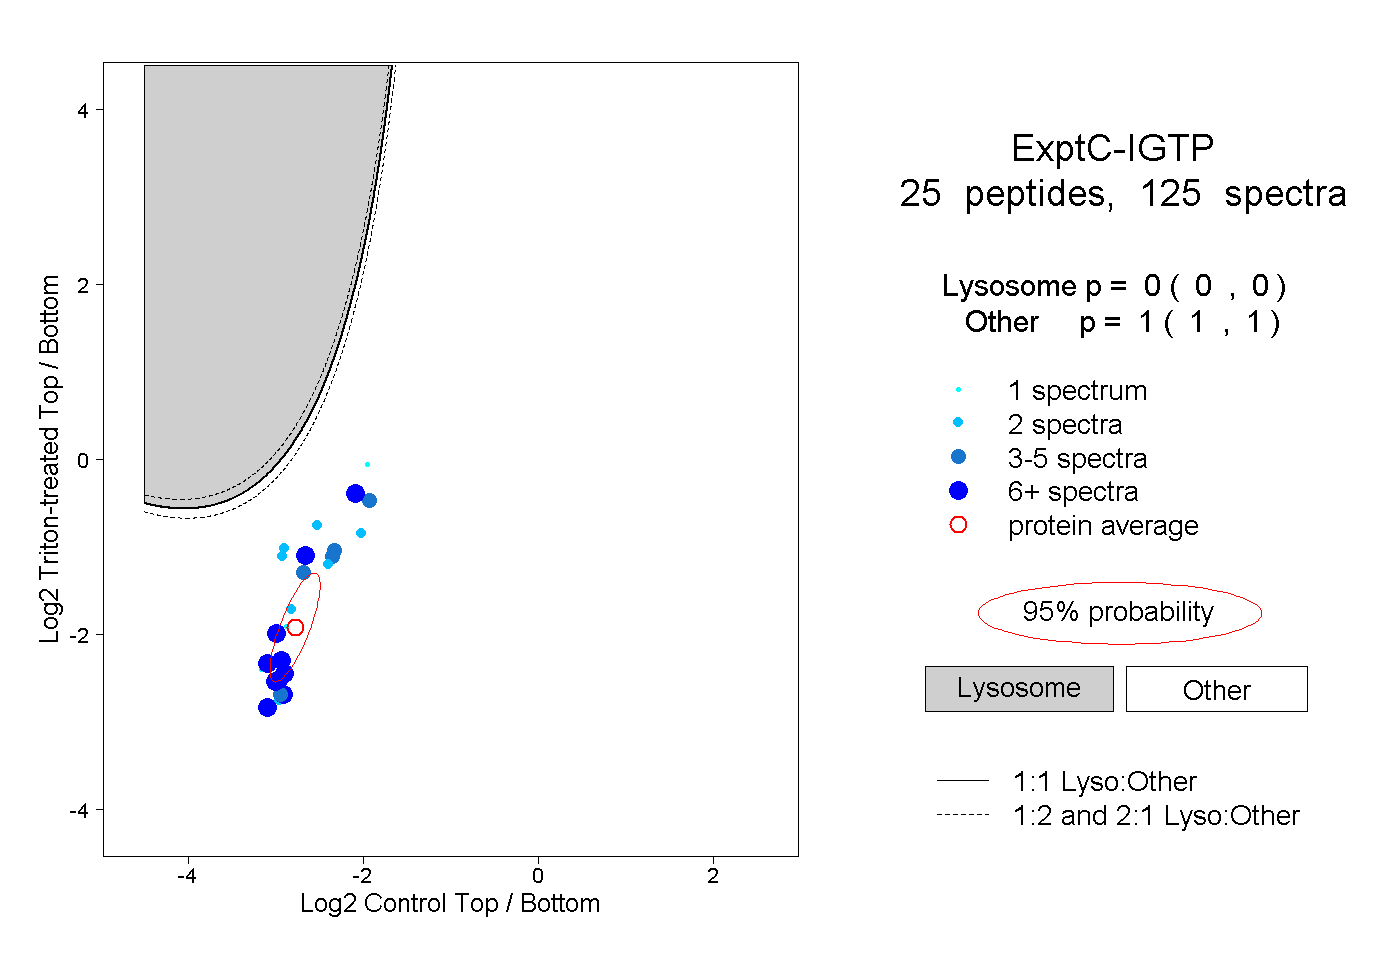 |
0.000 0.000 | 0.000 |
1.000 1.000 | 1.000 |
||||||||
| Plot | Lyso | Other | |||||||||||
| Expt D |
6 peptides |
20 spectra |
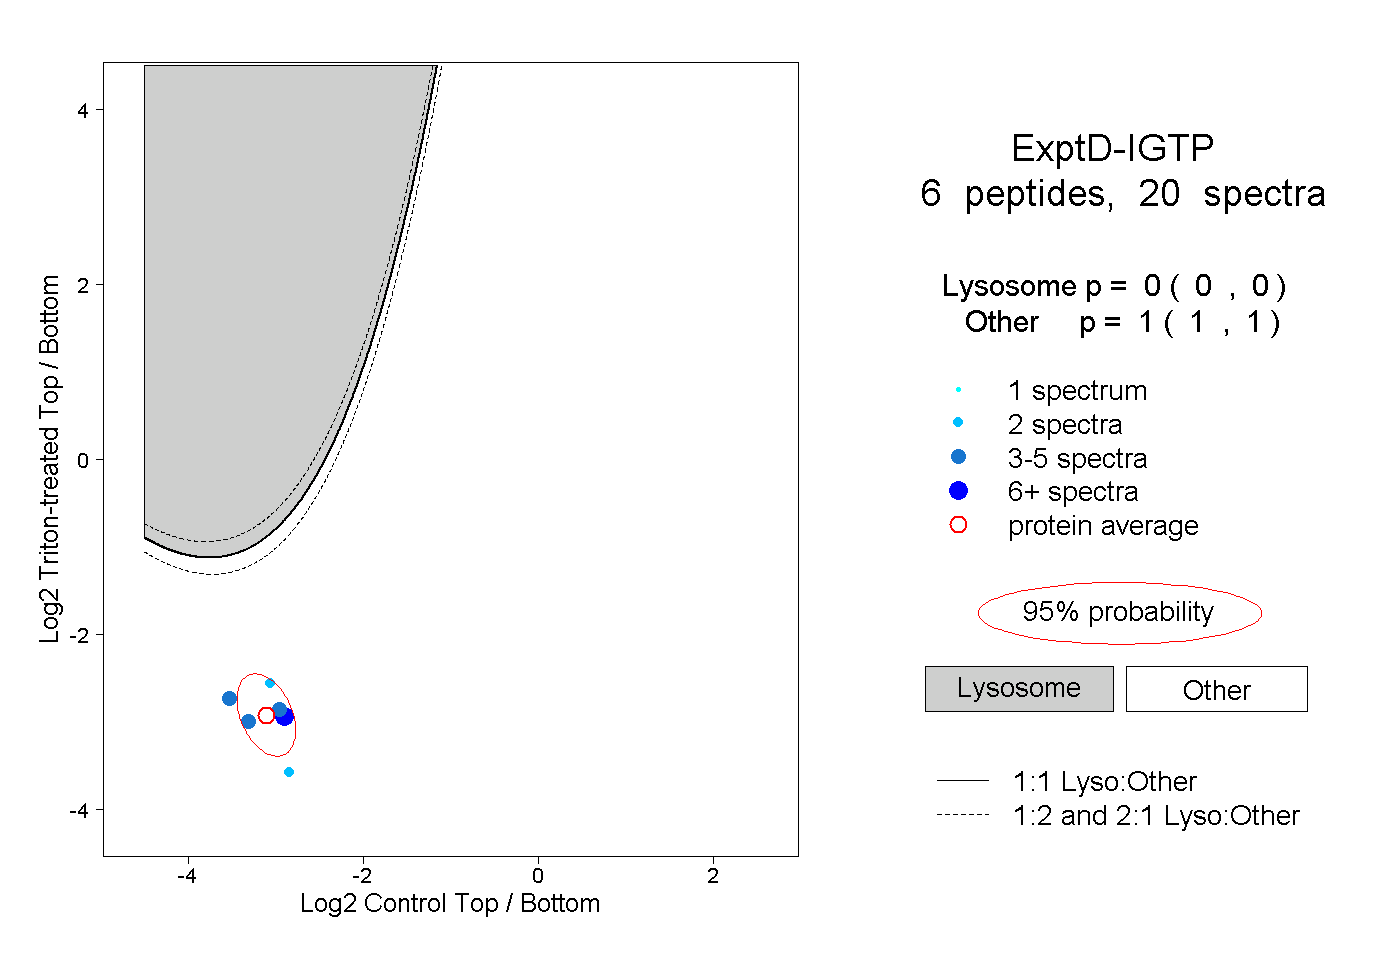 |
0.000 0.000 | 0.000 |
1.000 1.000 | 1.000 |