 3
3peptides
spectra
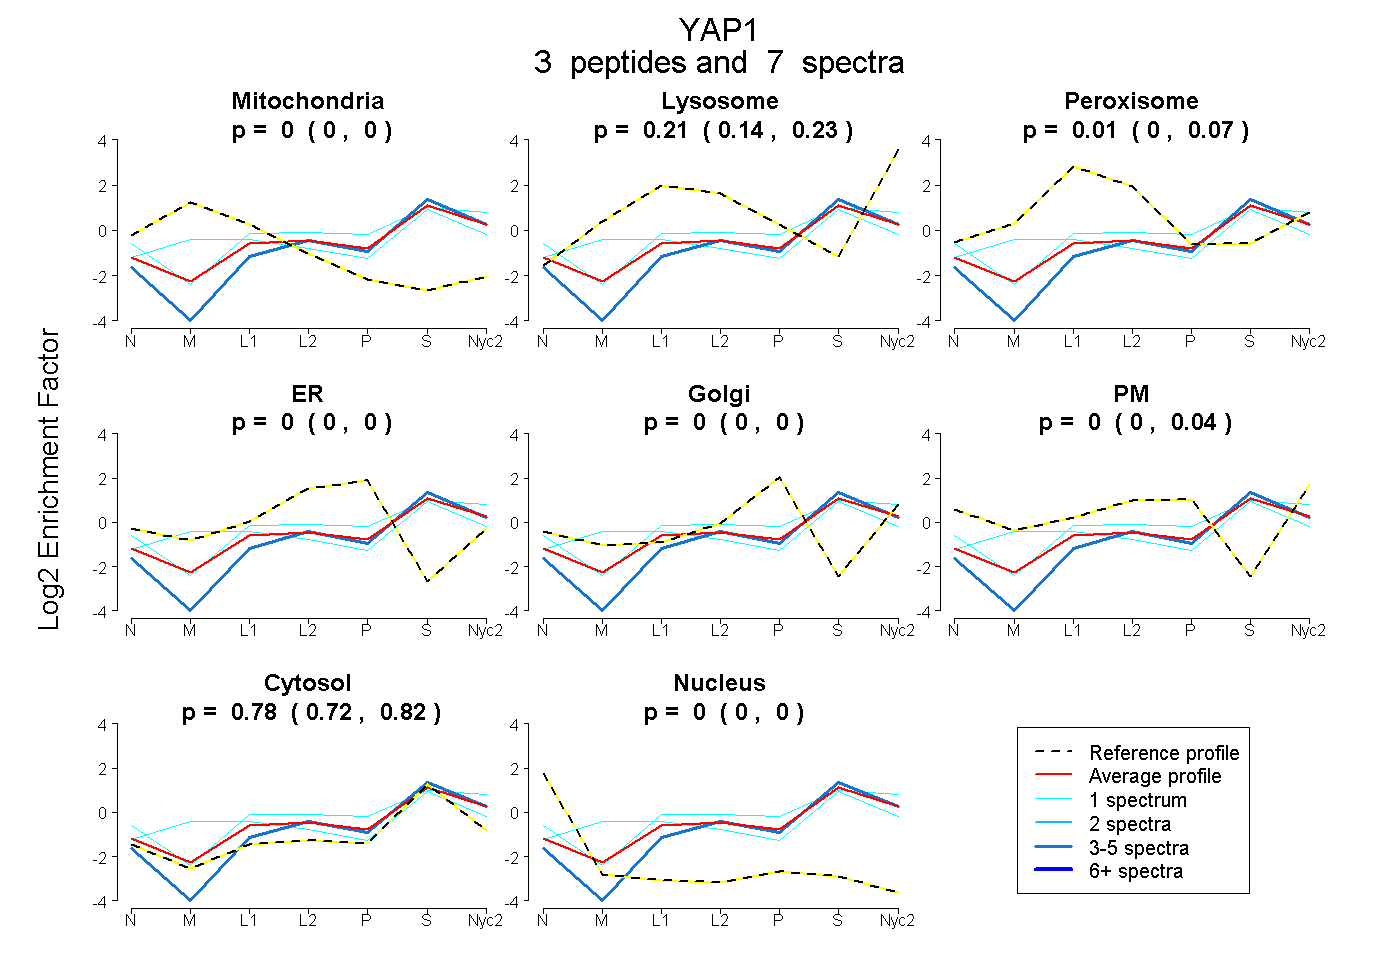
0.000 | 0.000
0.143 | 0.228
0.000 | 0.070
0.000 | 0.005
0.000 | 0.000
0.000 | 0.043
0.724 | 0.818
0.000 | 0.000
| Plot | Mito | Lyso | Perox | ER | Golgi | PM | Cytosol | Nucleus | |||||
| Expt A |
3 peptides |
7 spectra |
|
0.000 0.000 | 0.000 |
0.210 0.143 | 0.228 |
0.009 0.000 | 0.070 |
0.000 0.000 | 0.005 |
0.000 0.000 | 0.000 |
0.000 0.000 | 0.043 |
0.781 0.724 | 0.818 |
0.000 0.000 | 0.000 |
| 1 spectrum, FAMNQR | 0.158 | 0.142 | 0.083 | 0.000 | 0.000 | 0.000 | 0.617 | 0.000 | ||
| 5 spectra, TANVPQTVPMR | 0.000 | 0.078 | 0.000 | 0.000 | 0.000 | 0.000 | 0.922 | 0.000 | ||
| 1 spectrum, QASTDAGTAGALTPQHVR | 0.000 | 0.219 | 0.014 | 0.000 | 0.000 | 0.118 | 0.650 | 0.000 |
| Plot | Lyso | Other | |||||||||||
| Expt C |
2 peptides |
2 spectra |
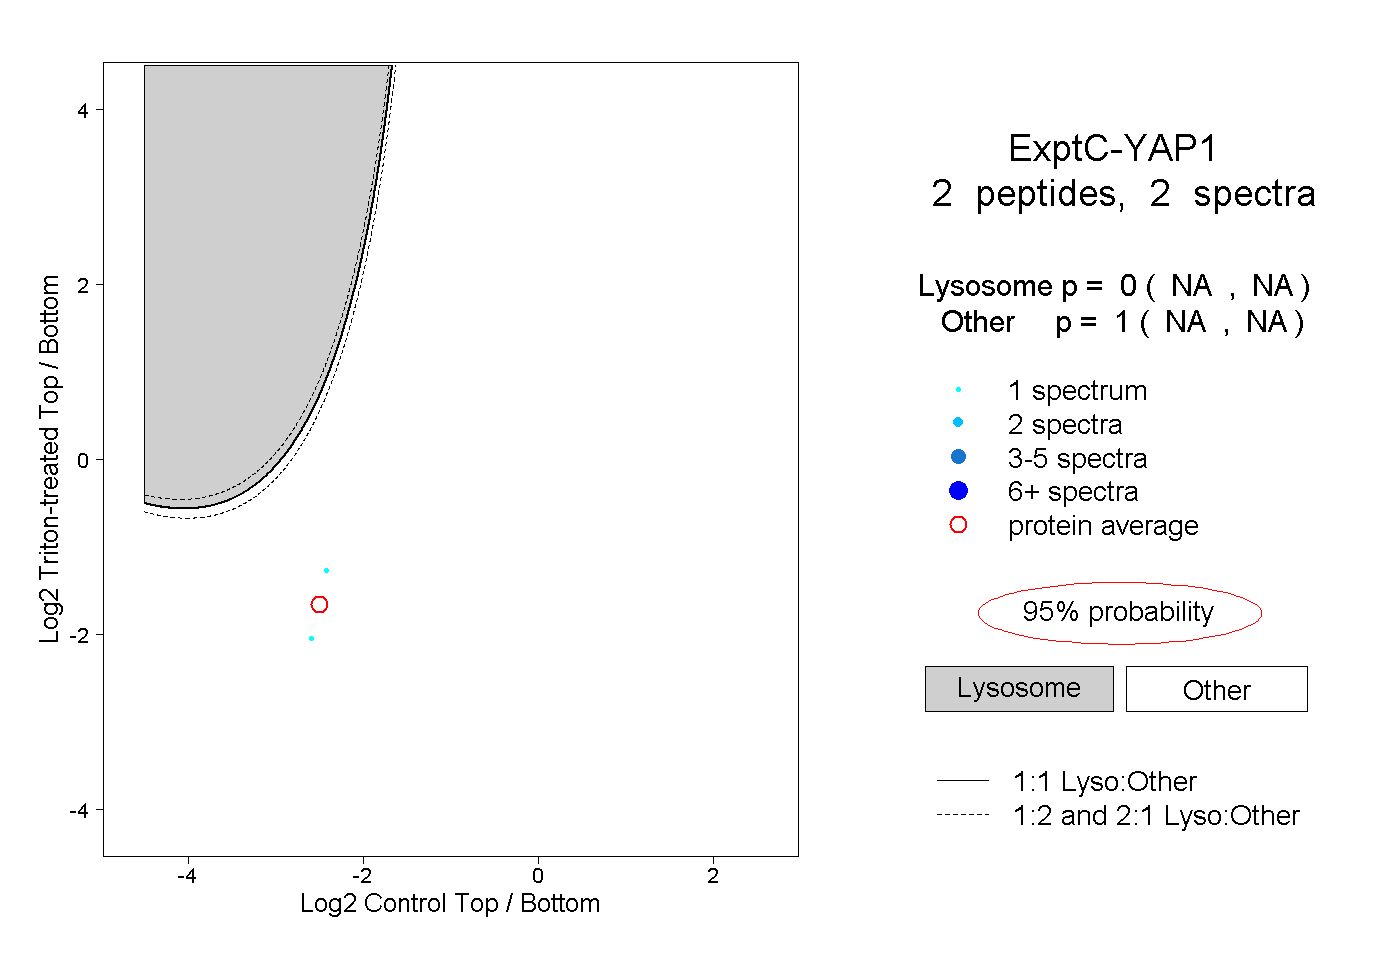 |
0.000 NA | NA |
1.000 NA | NA |