 2
2peptides
spectra
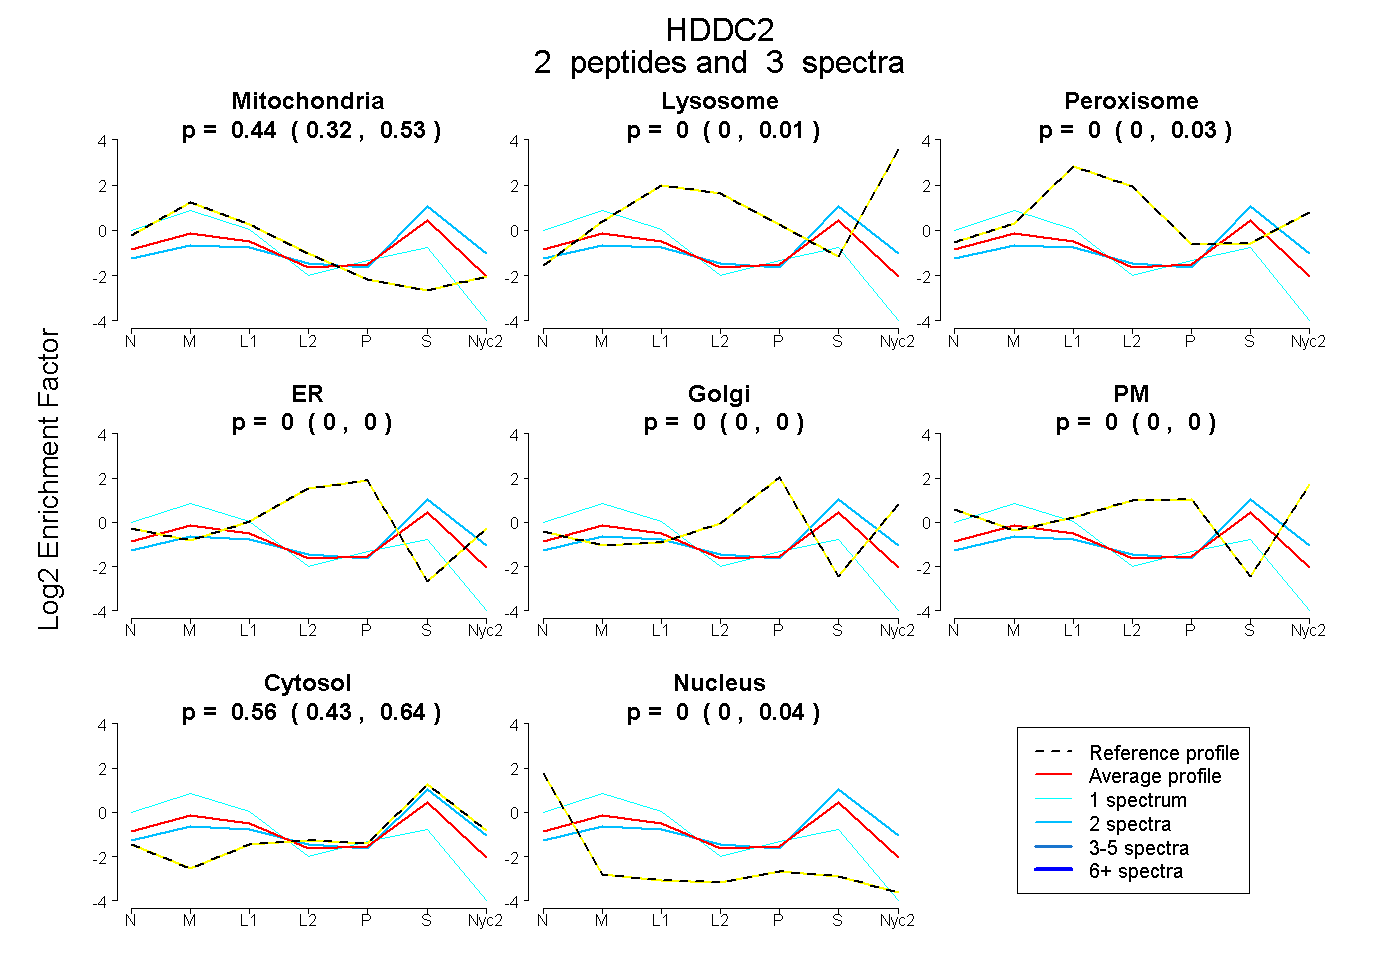
0.317 | 0.530
0.000 | 0.007
0.000 | 0.034
0.000 | 0.000
0.000 | 0.000
0.000 | 0.000
0.432 | 0.643
0.000 | 0.044
1peptide
spectra
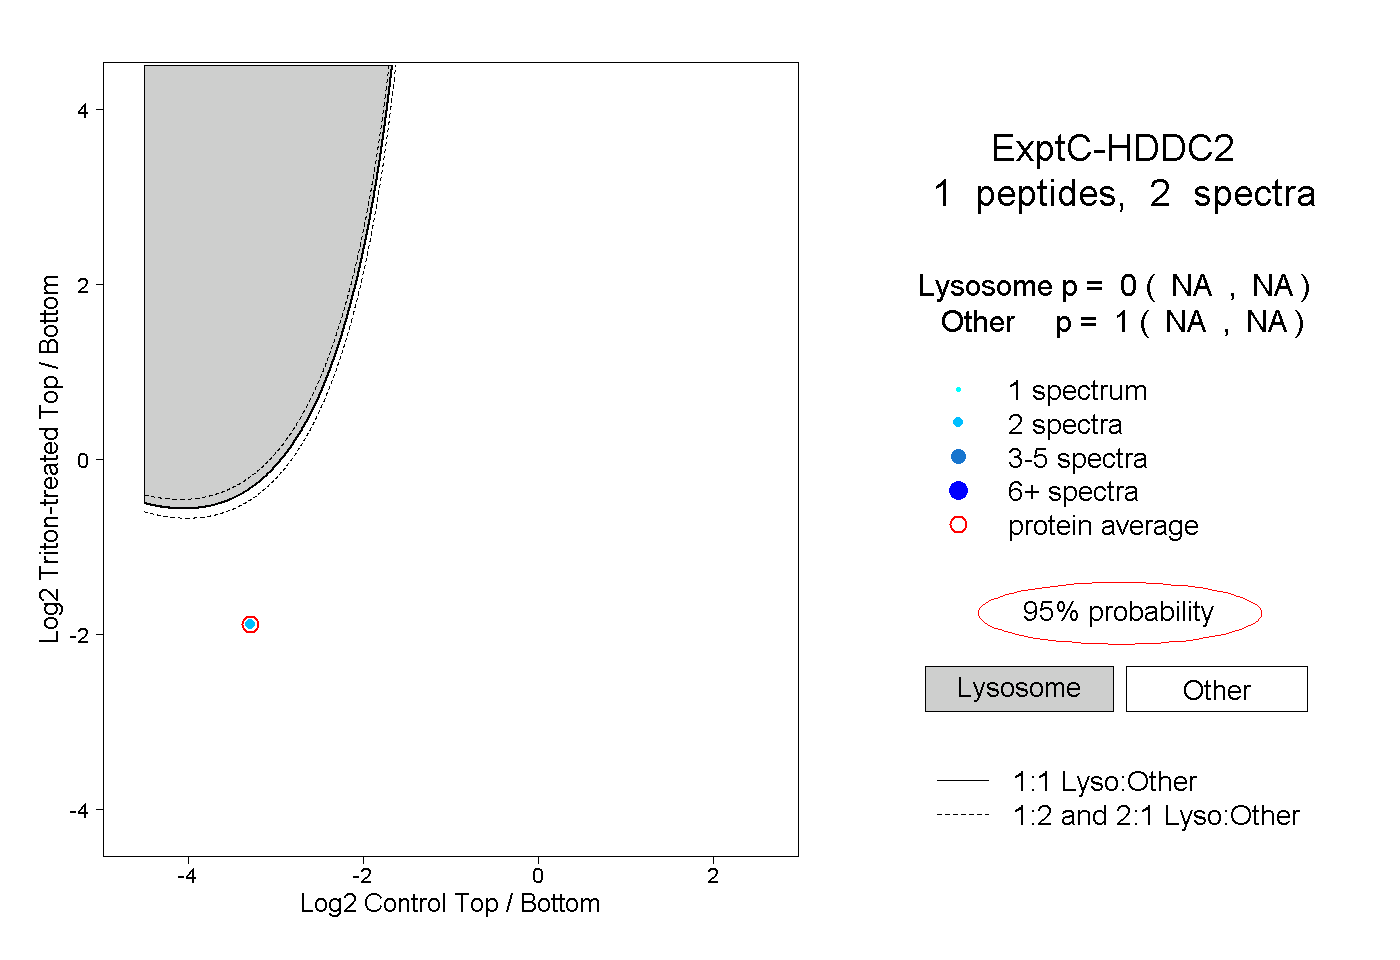
NA | NA
NA | NA
| Plot | Mito | Lyso | Perox | ER | Golgi | PM | Cytosol | Nucleus | |||||
| Expt A |
2 peptides |
3 spectra |
|
0.444 0.317 | 0.530 |
0.000 0.000 | 0.007 |
0.000 0.000 | 0.034 |
0.000 0.000 | 0.000 |
0.000 0.000 | 0.000 |
0.000 0.000 | 0.000 |
0.556 0.432 | 0.643 |
0.000 0.000 | 0.044 |
||
| Plot | Lyso | Other | |||||||||||
| Expt C |
1 peptide |
2 spectra |
|
0.000 NA | NA |
1.000 NA | NA |