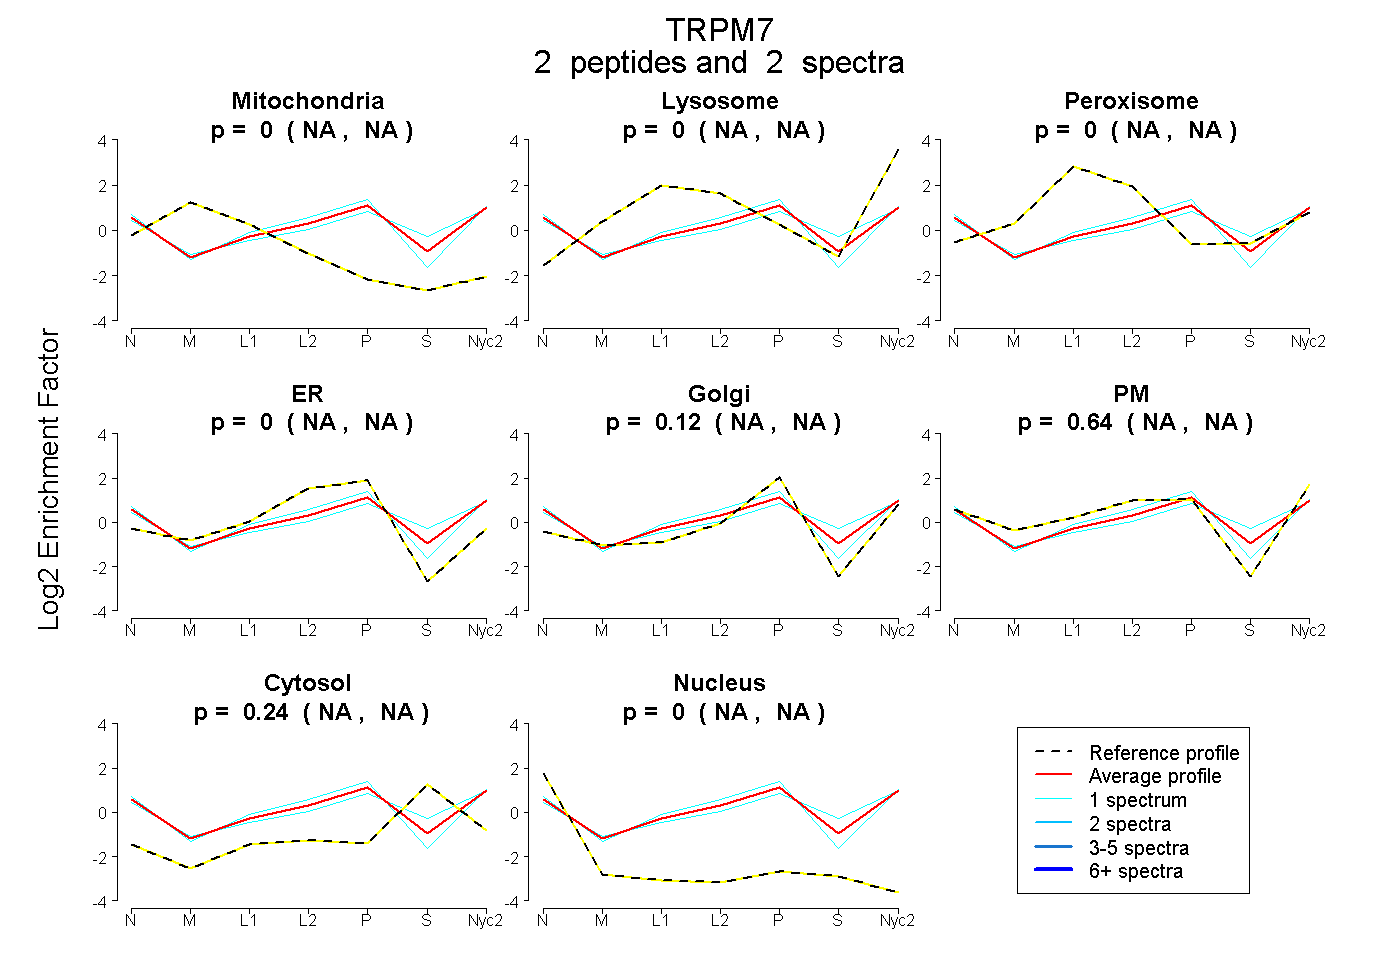
 2
2peptides
spectra
NA | NA
NA | NA
NA | NA
NA | NA
NA | NA
NA | NA
NA | NA
NA | NA
| Plot | Mito | Lyso | Perox | ER | Golgi | PM | Cytosol | Nucleus | |||||
| Expt A |
2 peptides |
2 spectra |
|
0.000 NA | NA |
0.000 NA | NA |
0.000 NA | NA |
0.000 NA | NA |
0.116 NA | NA |
0.641 NA | NA |
0.243 NA | NA |
0.000 NA | NA |
| 1 spectrum, AALLPDWLR | 0.000 | 0.000 | 0.000 | 0.079 | 0.168 | 0.626 | 0.127 | 0.000 | ||
| 1 spectrum, SIPYSPR | 0.000 | 0.000 | 0.000 | 0.000 | 0.014 | 0.626 | 0.360 | 0.000 |
| Plot | Lyso | Other | |||||||||||
| Expt C |
6 peptides |
10 spectra |
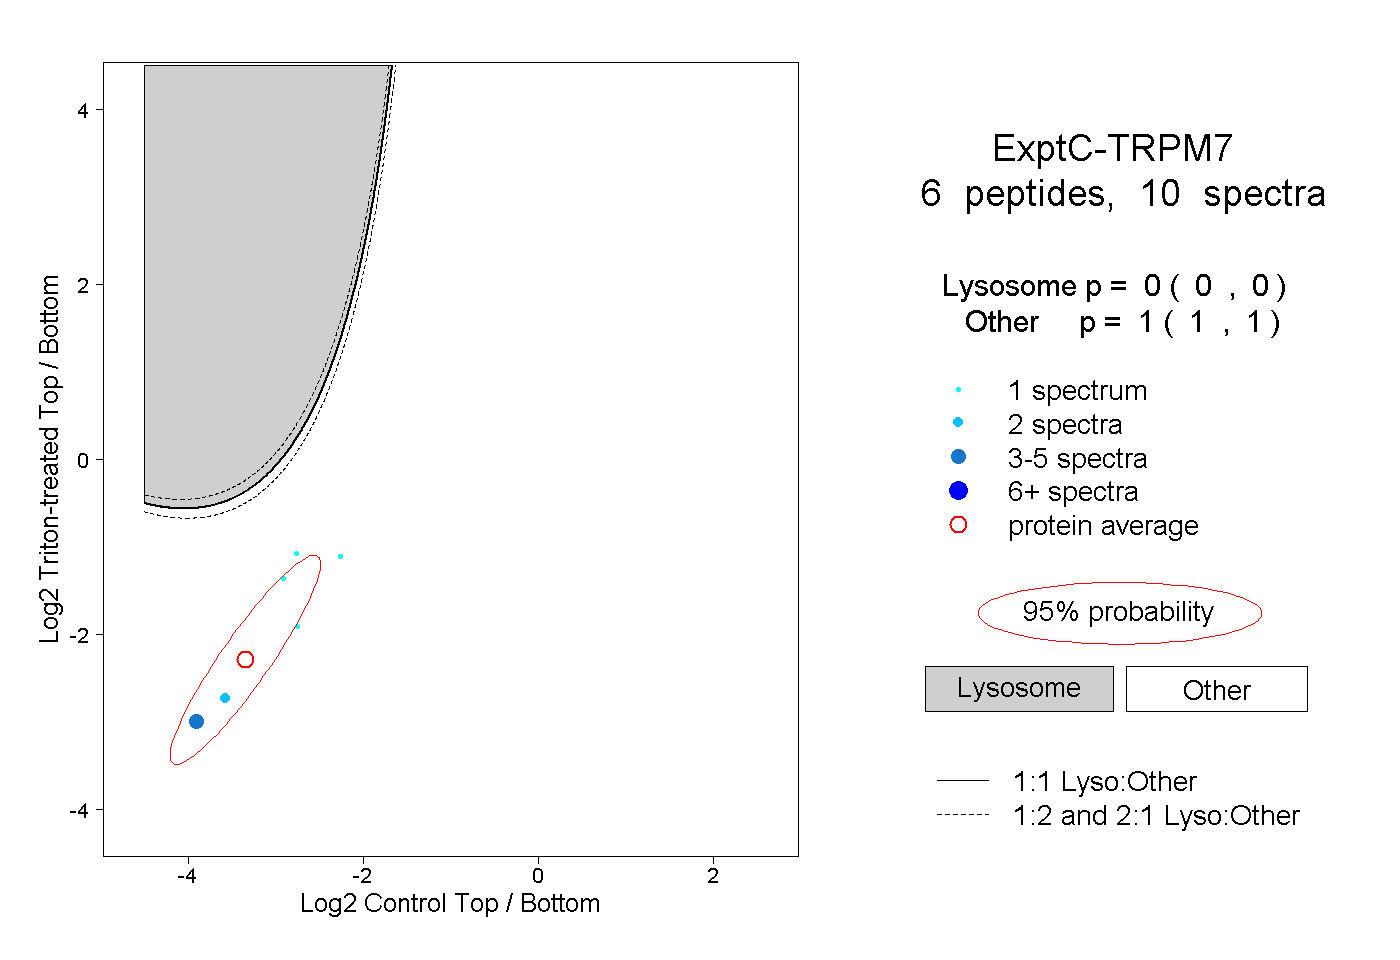 |
0.000 0.000 | 0.000 |
1.000 1.000 | 1.000 |