 2
2peptides
spectra
0.000 | 0.094
0.000 | 0.145
0.000 | 0.210
0.000 | 0.455
0.000 | 0.262
0.000 | 0.130
0.320 | 0.602
0.000 | 0.065
3peptides
spectra
0.000 | 0.000
1.000 | 1.000
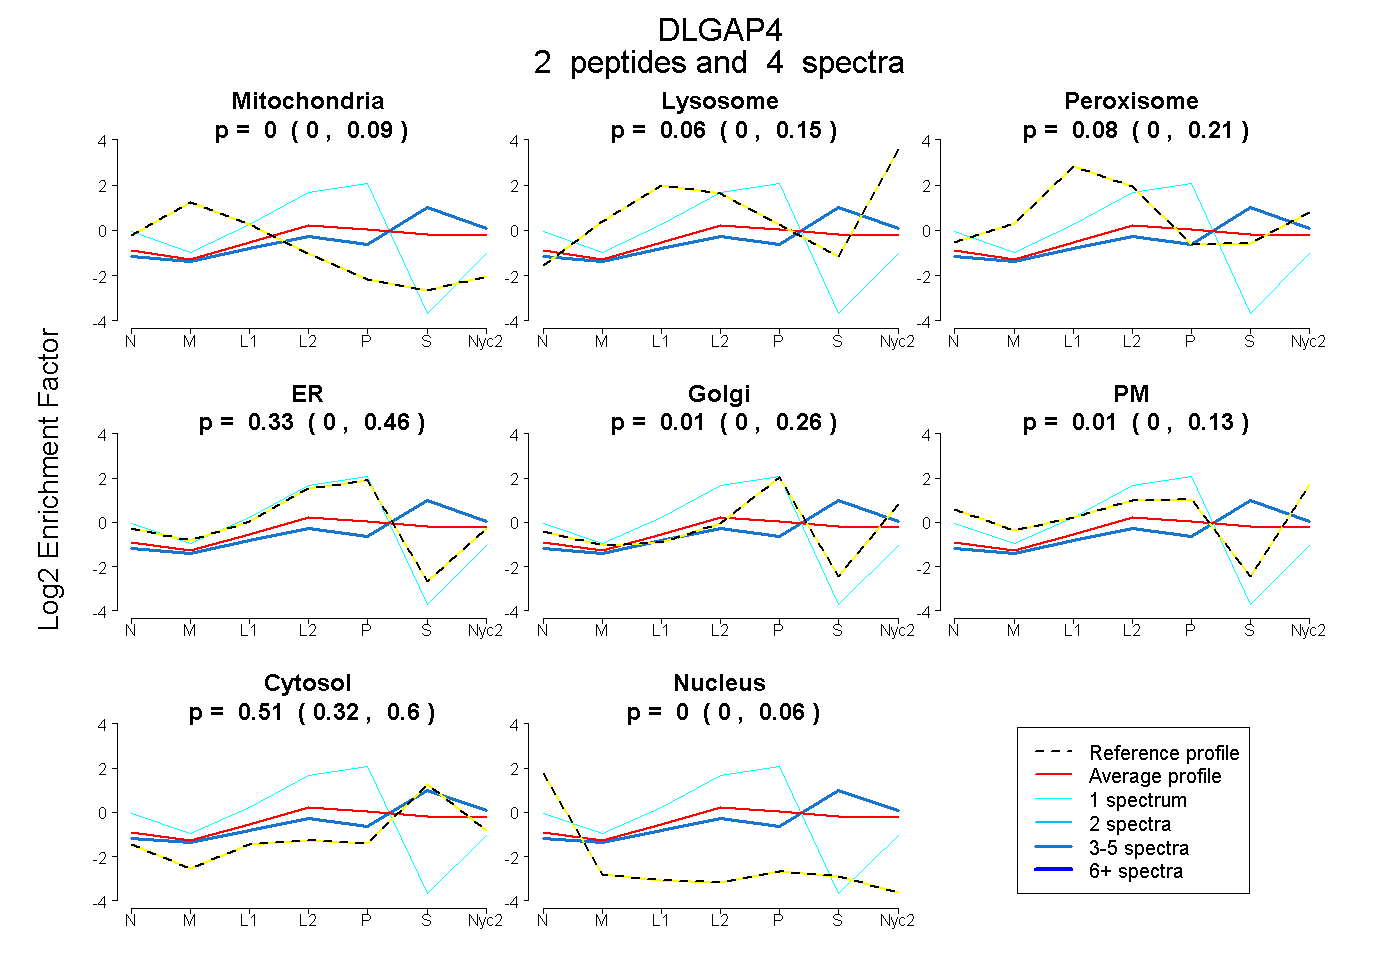
| Plot | Mito | Lyso | Perox | ER | Golgi | PM | Cytosol | Nucleus | |||||
| Expt A |
2 peptides |
4 spectra |
|
0.000 0.000 | 0.094 |
0.063 0.000 | 0.145 |
0.077 0.000 | 0.210 |
0.329 0.000 | 0.455 |
0.006 0.000 | 0.262 |
0.015 0.000 | 0.130 |
0.510 0.320 | 0.602 |
0.000 0.000 | 0.065 |
||
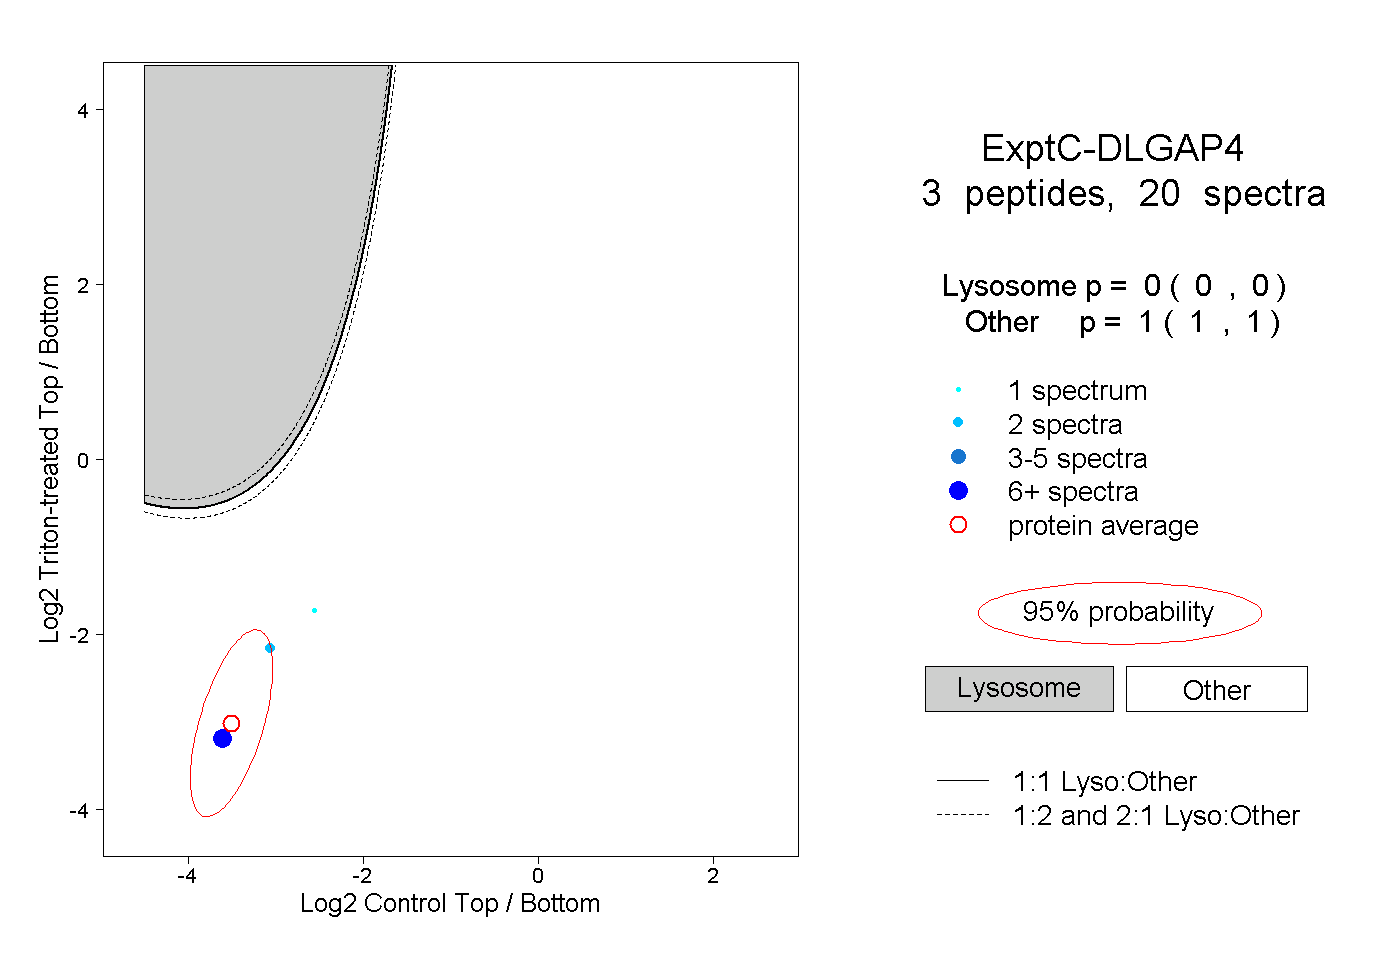
| Plot | Lyso | Other | |||||||||||
| Expt C |
3 peptides |
20 spectra |
|
0.000 0.000 | 0.000 |
1.000 1.000 | 1.000 |