17
17peptides
spectra
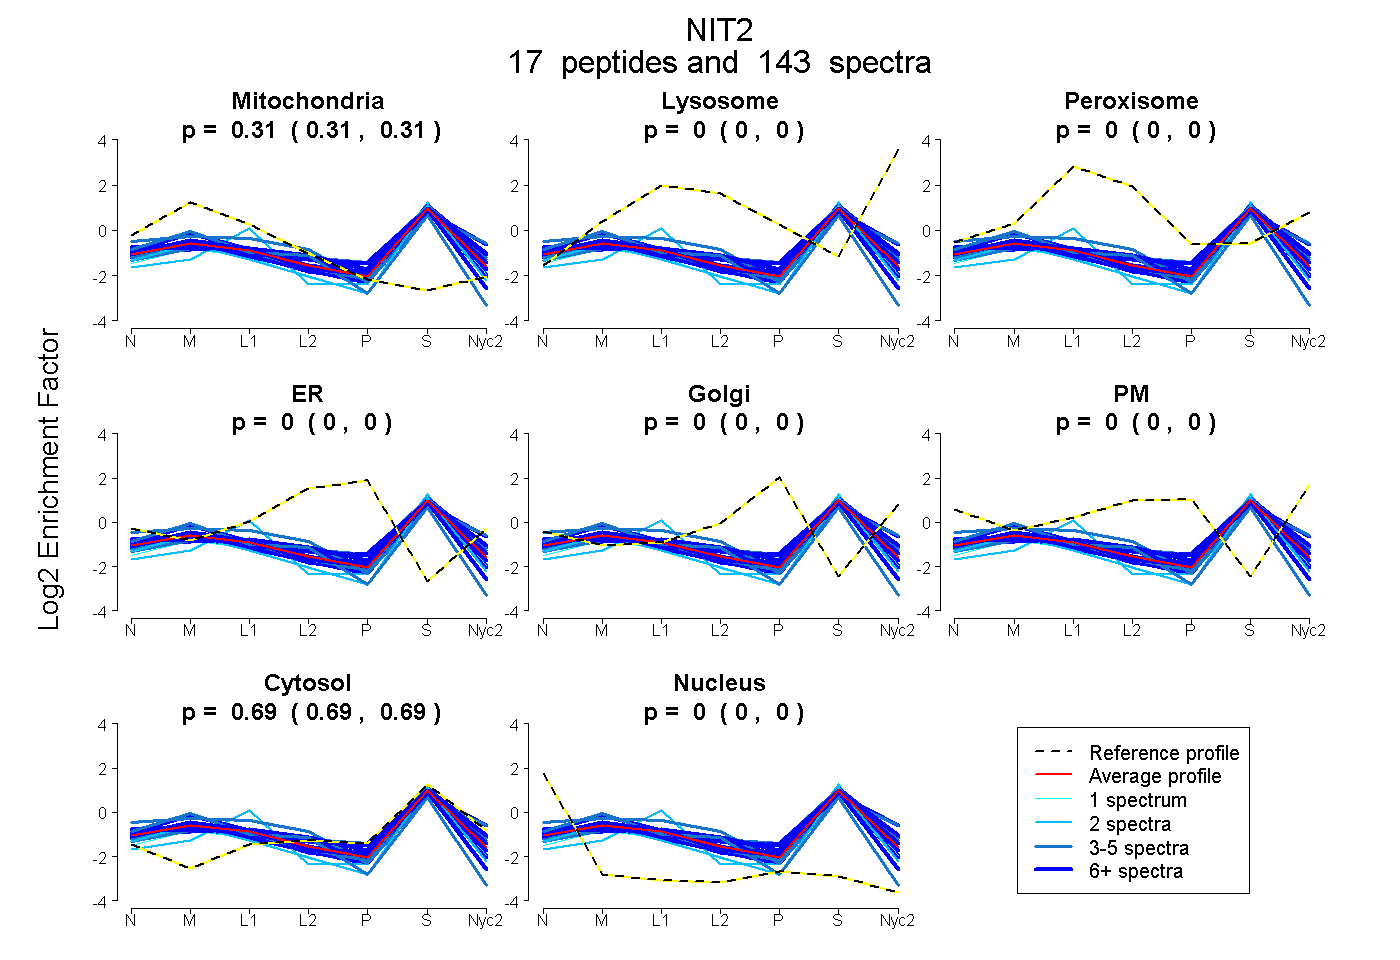
0.309 | 0.312
0.000 | 0.000
0.000 | 0.000
0.000 | 0.000
0.000 | 0.000
0.000 | 0.000
0.687 | 0.690
0.000 | 0.000
8peptides
spectra
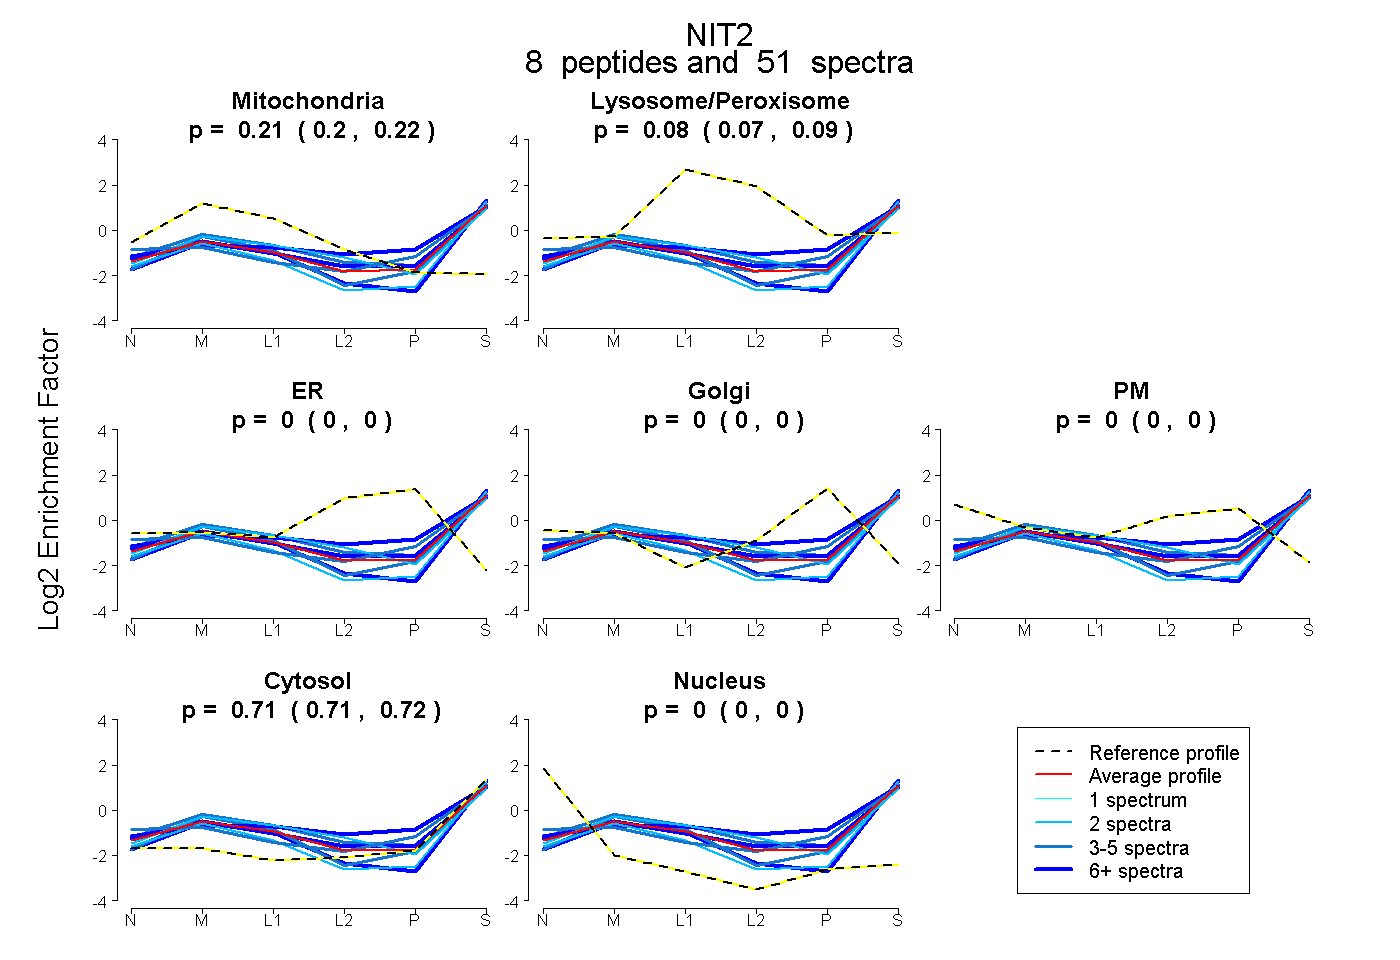
0.200 | 0.216
0.070 | 0.088
0.000 | 0.000
0.000 | 0.000
0.000 | 0.000
0.708 | 0.715
0.000 | 0.000