 19
19peptides
spectra
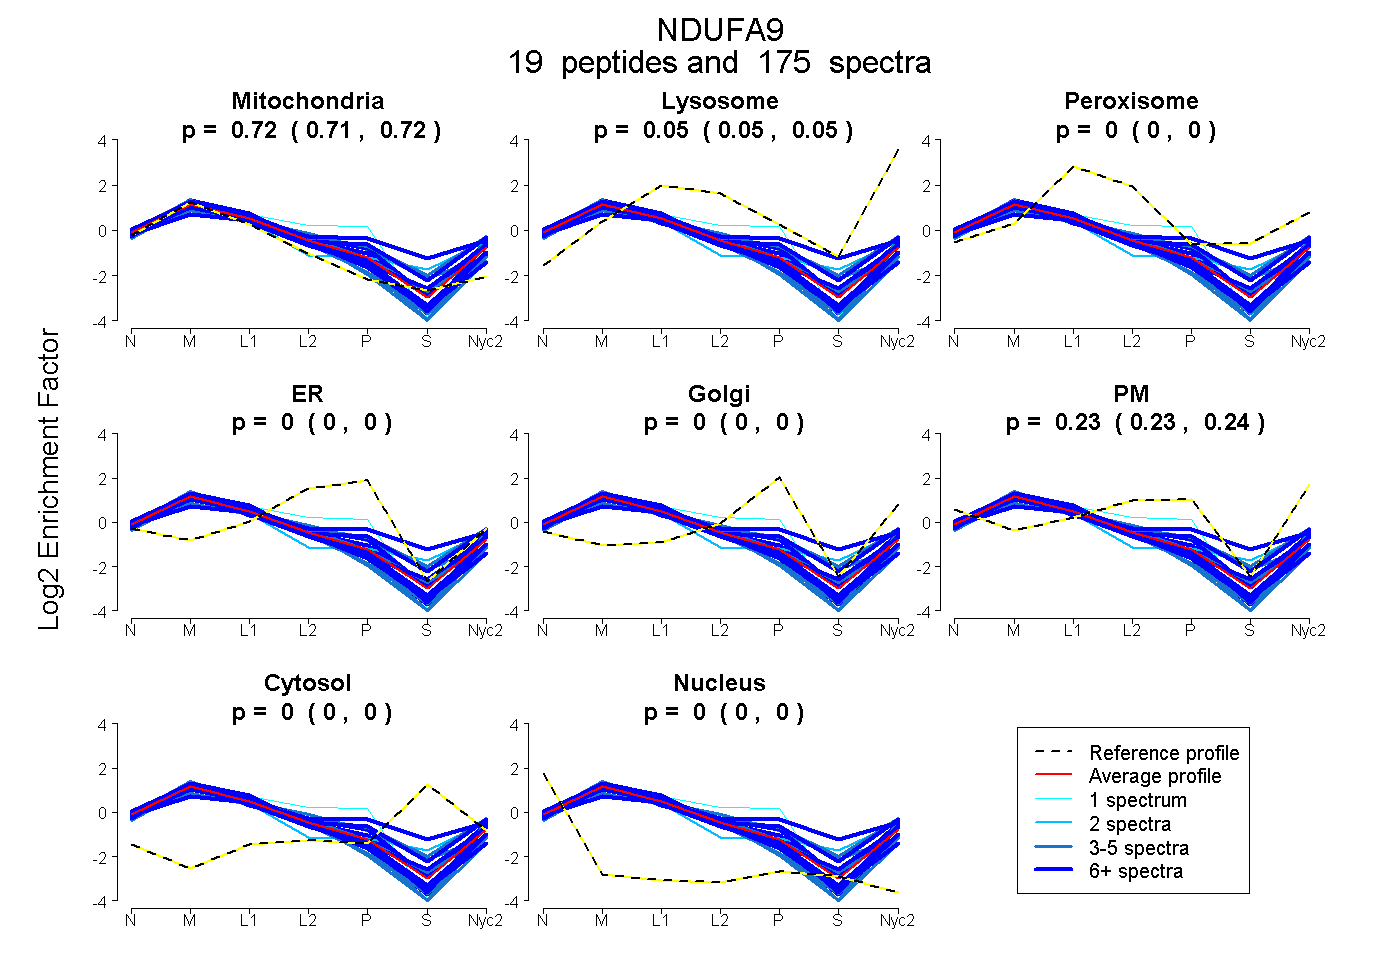
0.713 | 0.717
0.048 | 0.054
0.000 | 0.000
0.000 | 0.000
0.000 | 0.000
0.230 | 0.237
0.000 | 0.000
0.000 | 0.000
17peptides
spectra
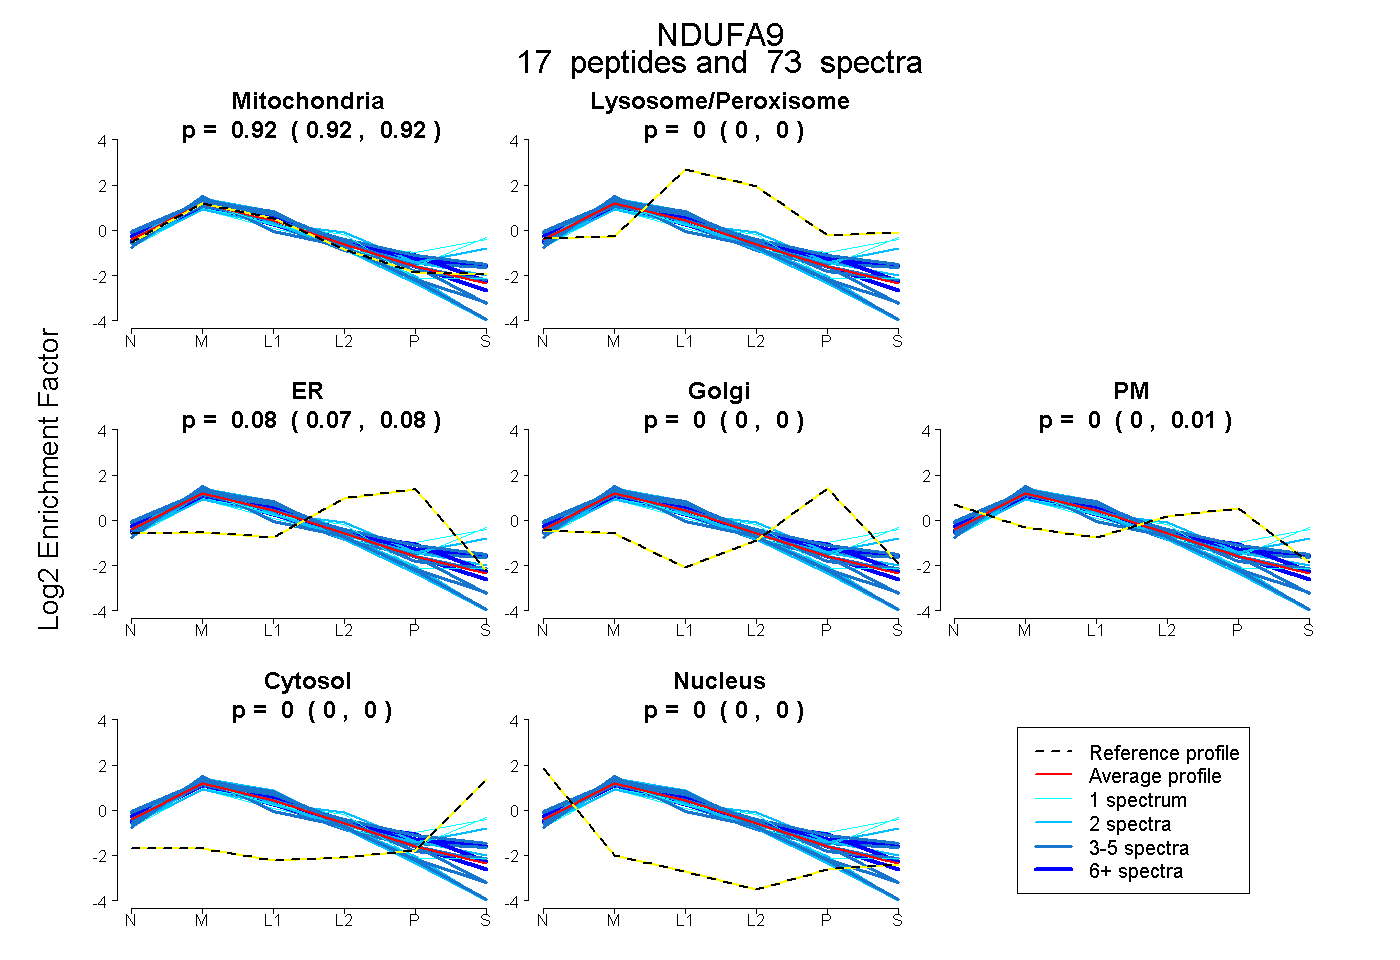
0.915 | 0.924
0.000 | 0.000
0.069 | 0.083
0.000 | 0.000
0.000 | 0.010
0.000 | 0.000
0.000 | 0.000
22peptides
spectra
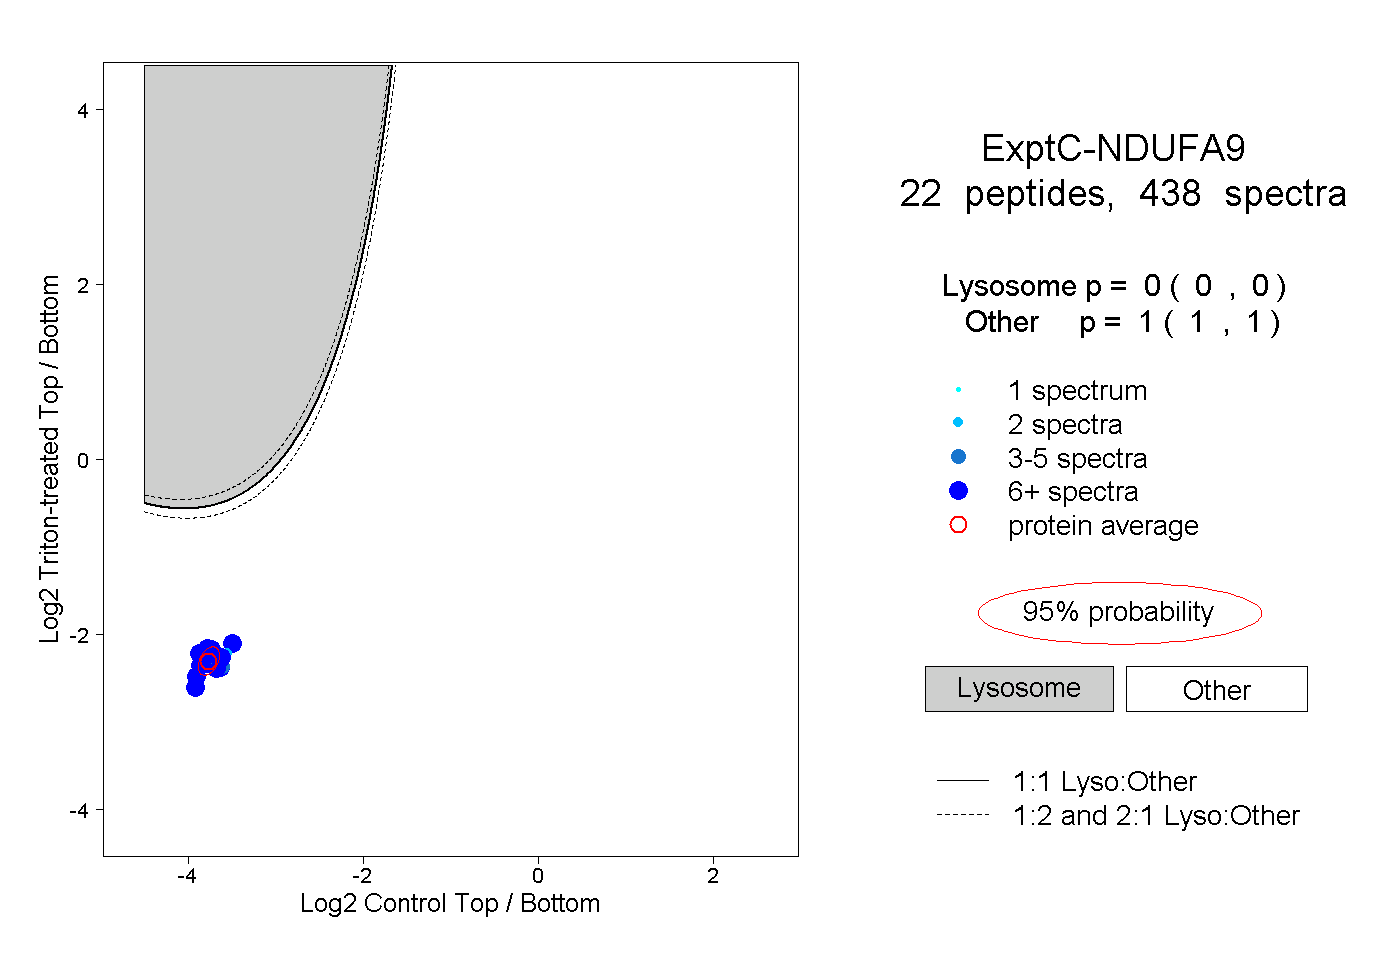
0.000 | 0.000
1.000 | 1.000
12peptides
spectra
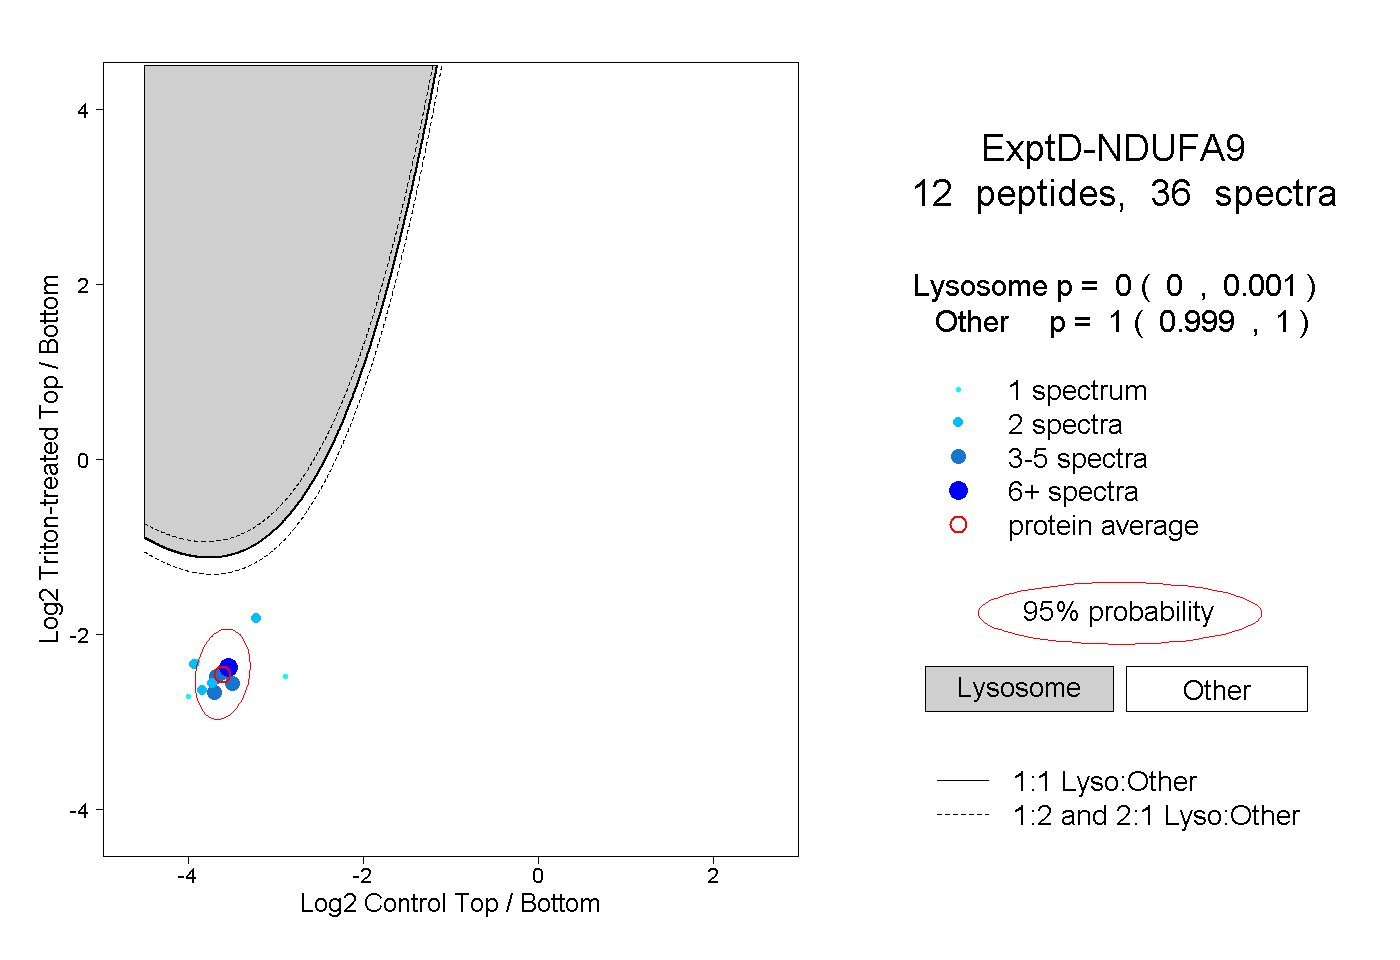
0.000 | 0.001
0.999 | 1.000