 5
5peptides
spectra
0.000 | 0.000
0.000 | 0.000
0.000 | 0.000
0.000 | 0.086
0.000 | 0.000
0.000 | 0.000
0.041 | 0.181
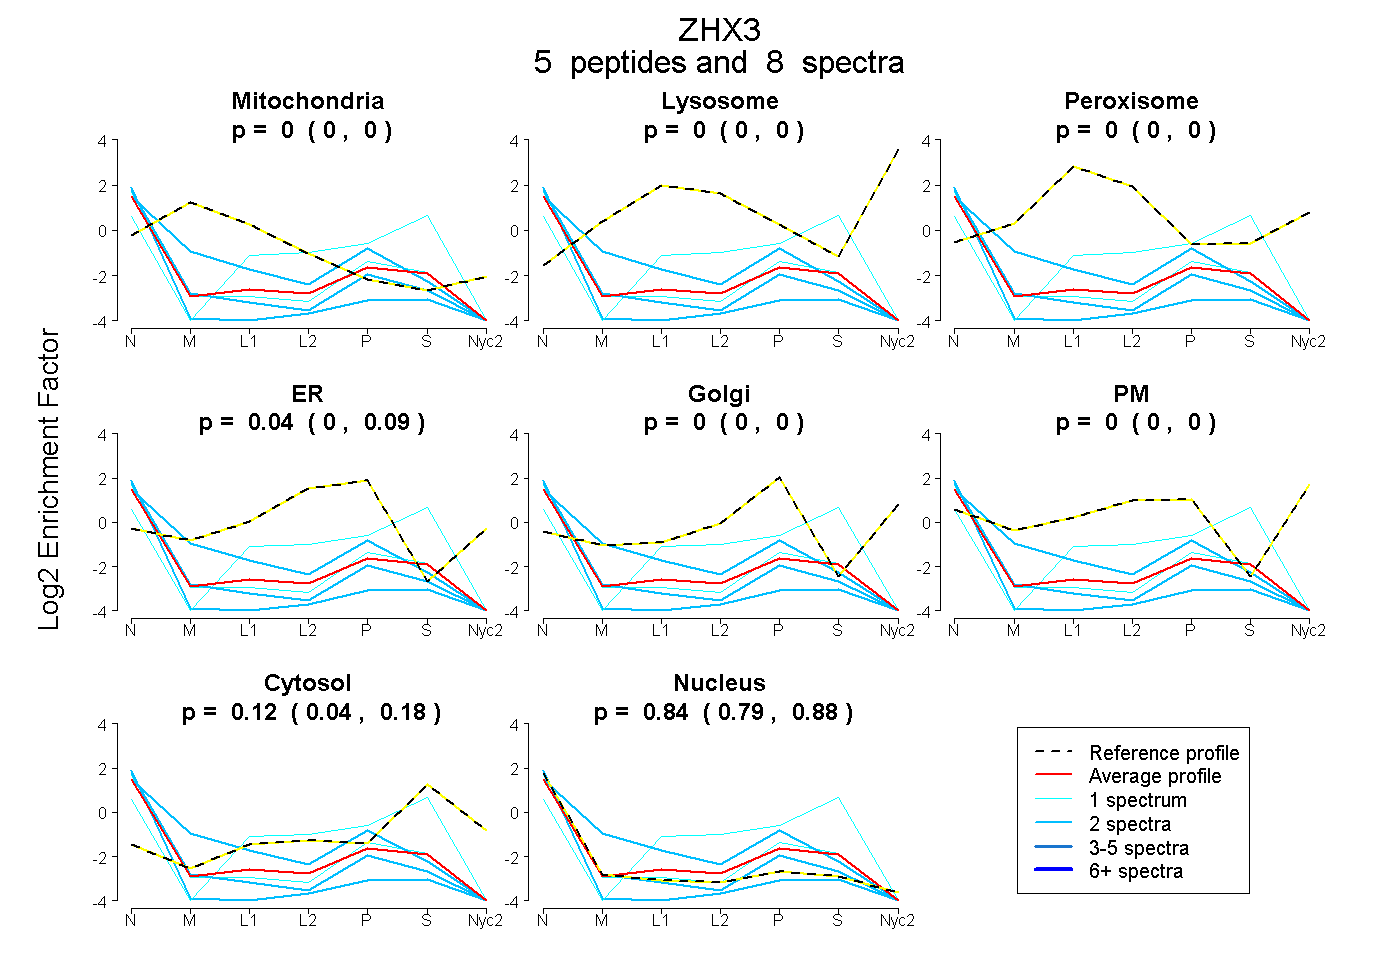
0.792 | 0.880
| Plot | Mito | Lyso | Perox | ER | Golgi | PM | Cytosol | Nucleus | |||||
| Expt A |
5 peptides |
8 spectra |
|
0.000 0.000 | 0.000 |
0.000 0.000 | 0.000 |
0.000 0.000 | 0.000 |
0.038 0.000 | 0.086 |
0.000 0.000 | 0.000 |
0.000 0.000 | 0.000 |
0.123 0.041 | 0.181 |
0.839 0.792 | 0.880 |
| 1 spectrum, QGISWSPEEIEDAR | 0.000 | 0.000 | 0.000 | 0.053 | 0.000 | 0.000 | 0.585 | 0.362 | ||
| 1 spectrum, APEQLR | 0.000 | 0.000 | 0.000 | 0.012 | 0.004 | 0.000 | 0.108 | 0.876 | ||
| 2 spectra, YPEEQLK | 0.232 | 0.000 | 0.000 | 0.141 | 0.000 | 0.000 | 0.000 | 0.628 | ||
| 2 spectra, AVADTSSEDQGPGHGEPVAVDK | 0.000 | 0.000 | 0.000 | 0.000 | 0.000 | 0.000 | 0.000 | 1.000 | ||
| 2 spectra, VTGLSTR | 0.000 | 0.000 | 0.000 | 0.000 | 0.005 | 0.000 | 0.000 | 0.995 |