 10
10peptides
spectra
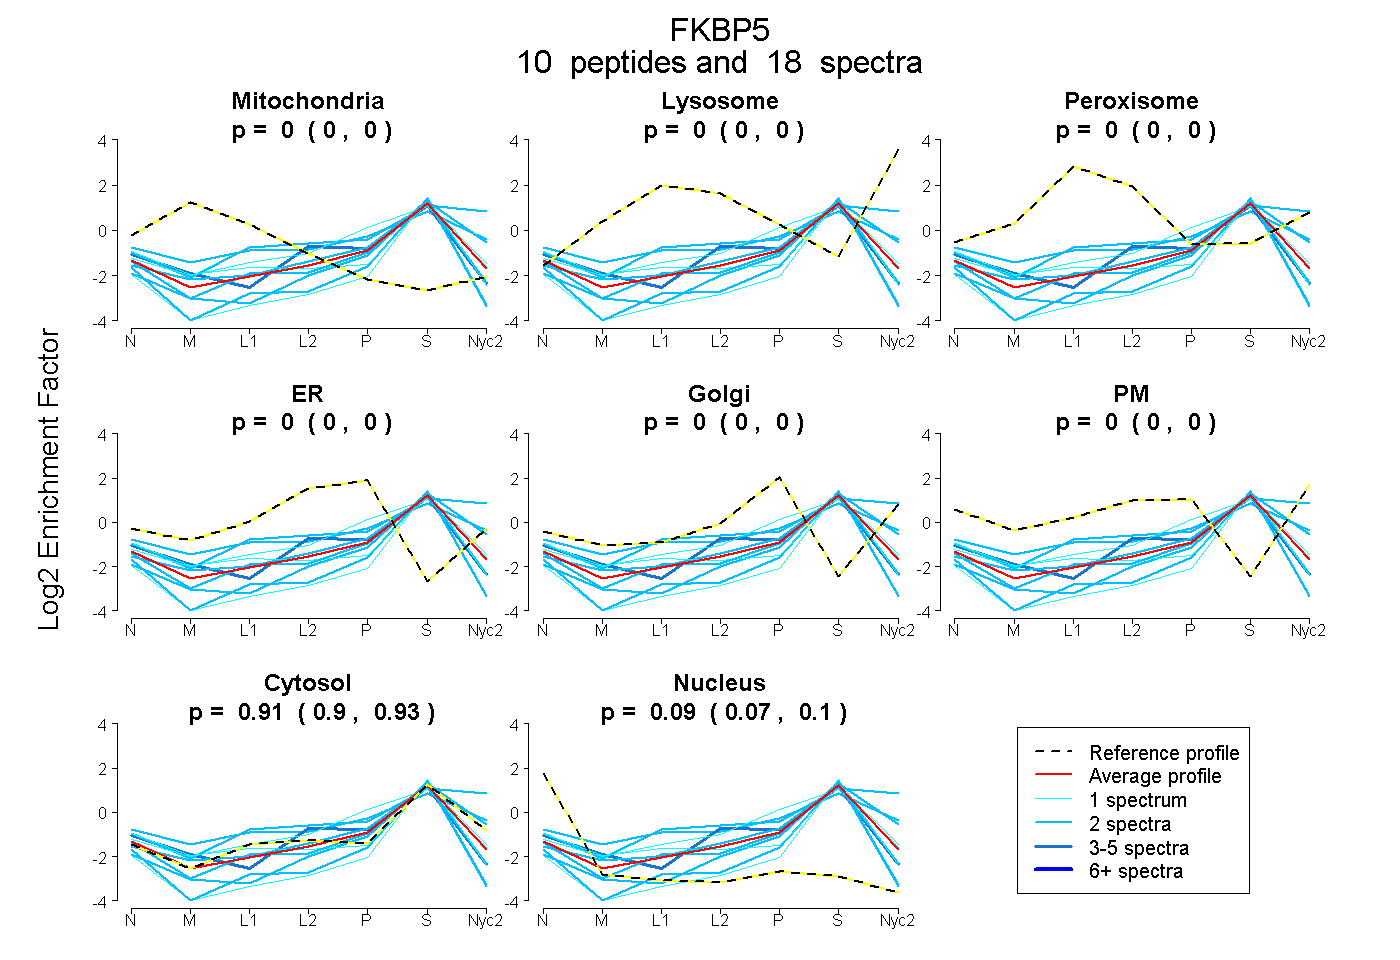
0.000 | 0.000
0.000 | 0.000
0.000 | 0.000
0.000 | 0.000
0.000 | 0.000
0.000 | 0.000
0.896 | 0.925
0.072 | 0.102
| Plot | Mito | Lyso | Perox | ER | Golgi | PM | Cytosol | Nucleus | |||||
| Expt A |
10 peptides |
18 spectra |
|
0.000 0.000 | 0.000 |
0.000 0.000 | 0.000 |
0.000 0.000 | 0.000 |
0.000 0.000 | 0.000 |
0.000 0.000 | 0.000 |
0.000 0.000 | 0.000 |
0.911 0.896 | 0.925 |
0.089 0.072 | 0.102 |
| 2 spectra, GEAQLLMNEFESAK | 0.000 | 0.000 | 0.000 | 0.000 | 0.000 | 0.000 | 0.786 | 0.214 | ||
| 2 spectra, VYANMFK | 0.000 | 0.000 | 0.000 | 0.000 | 0.003 | 0.000 | 0.984 | 0.012 | ||
| 2 spectra, AVEGAAGK | 0.000 | 0.232 | 0.000 | 0.000 | 0.037 | 0.015 | 0.716 | 0.000 | ||
| 1 spectrum, VLEVNPQNK | 0.048 | 0.000 | 0.000 | 0.000 | 0.000 | 0.000 | 0.866 | 0.086 | ||
| 1 spectrum, AWDIGVSTMK | 0.000 | 0.000 | 0.000 | 0.177 | 0.000 | 0.000 | 0.823 | 0.000 | ||
| 3 spectra, AVECCDK | 0.000 | 0.000 | 0.000 | 0.060 | 0.000 | 0.000 | 0.812 | 0.128 | ||
| 2 spectra, ESWEMDTK | 0.000 | 0.000 | 0.000 | 0.005 | 0.000 | 0.000 | 0.902 | 0.092 | ||
| 1 spectrum, GEDLFEDSGIIR | 0.000 | 0.000 | 0.000 | 0.000 | 0.000 | 0.000 | 0.787 | 0.213 | ||
| 2 spectra, ALGLDSANEK | 0.000 | 0.000 | 0.117 | 0.000 | 0.195 | 0.000 | 0.688 | 0.000 | ||
| 2 spectra, LQISVCQR | 0.000 | 0.000 | 0.000 | 0.000 | 0.000 | 0.000 | 0.745 | 0.255 |
| Plot | Mito | Lyso or Perox | ER | Golgi | PM | Cytosol | Nucleus | ||||||
| Expt B |
1 peptide |
2 spectra |
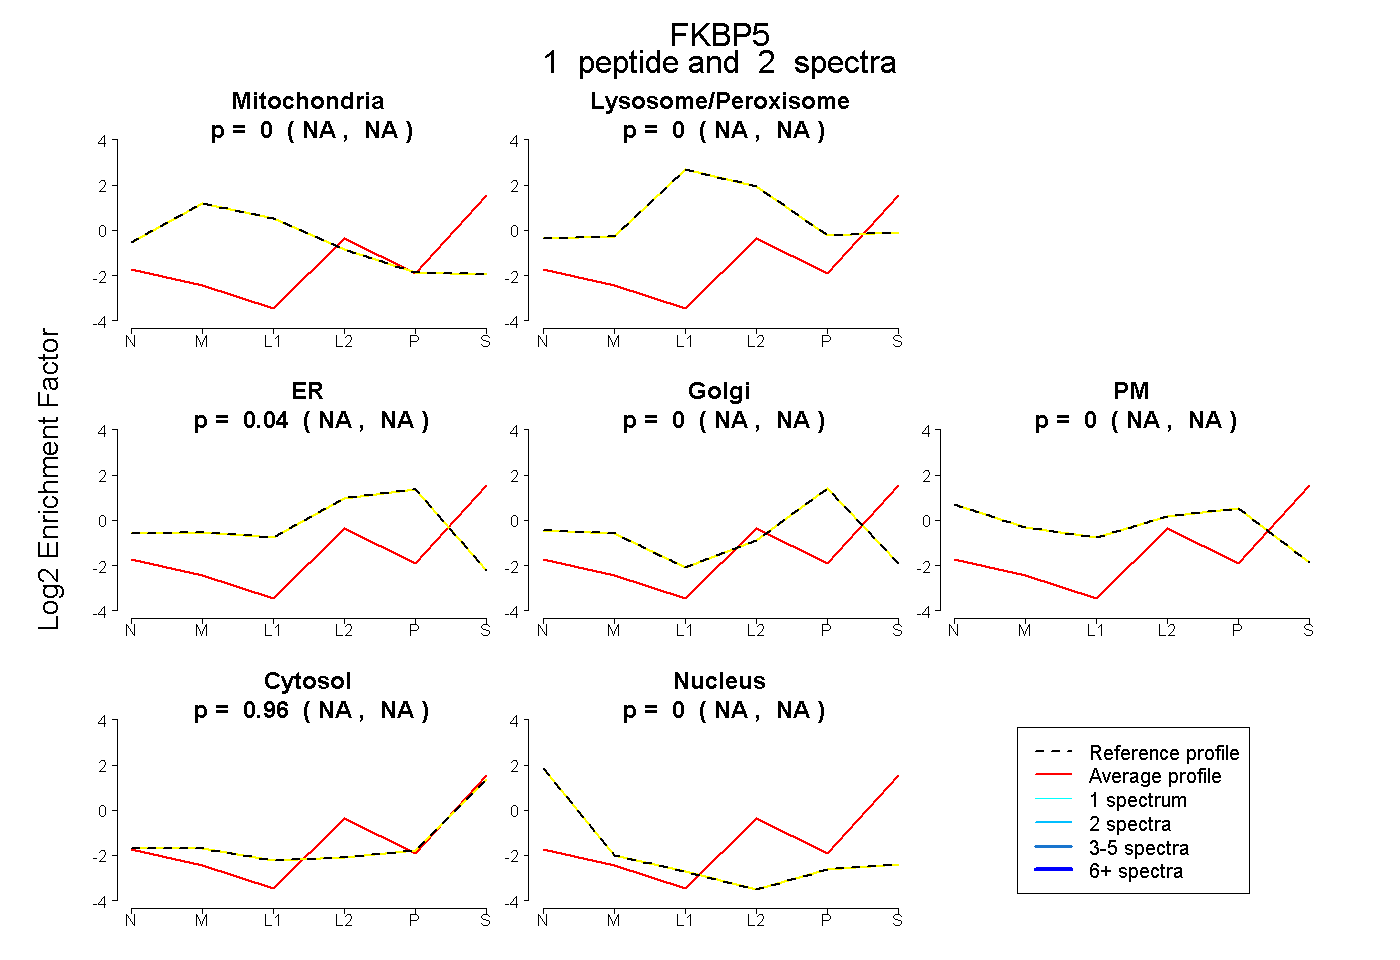 |
0.000 NA | NA |
0.000 NA | NA |
0.040 NA | NA |
0.000 NA | NA |
0.000 NA | NA |
0.960 NA | NA |
0.000 NA | NA |
|||
| Plot | Lyso | Other | |||||||||||
| Expt C |
1 peptide |
1 spectrum |
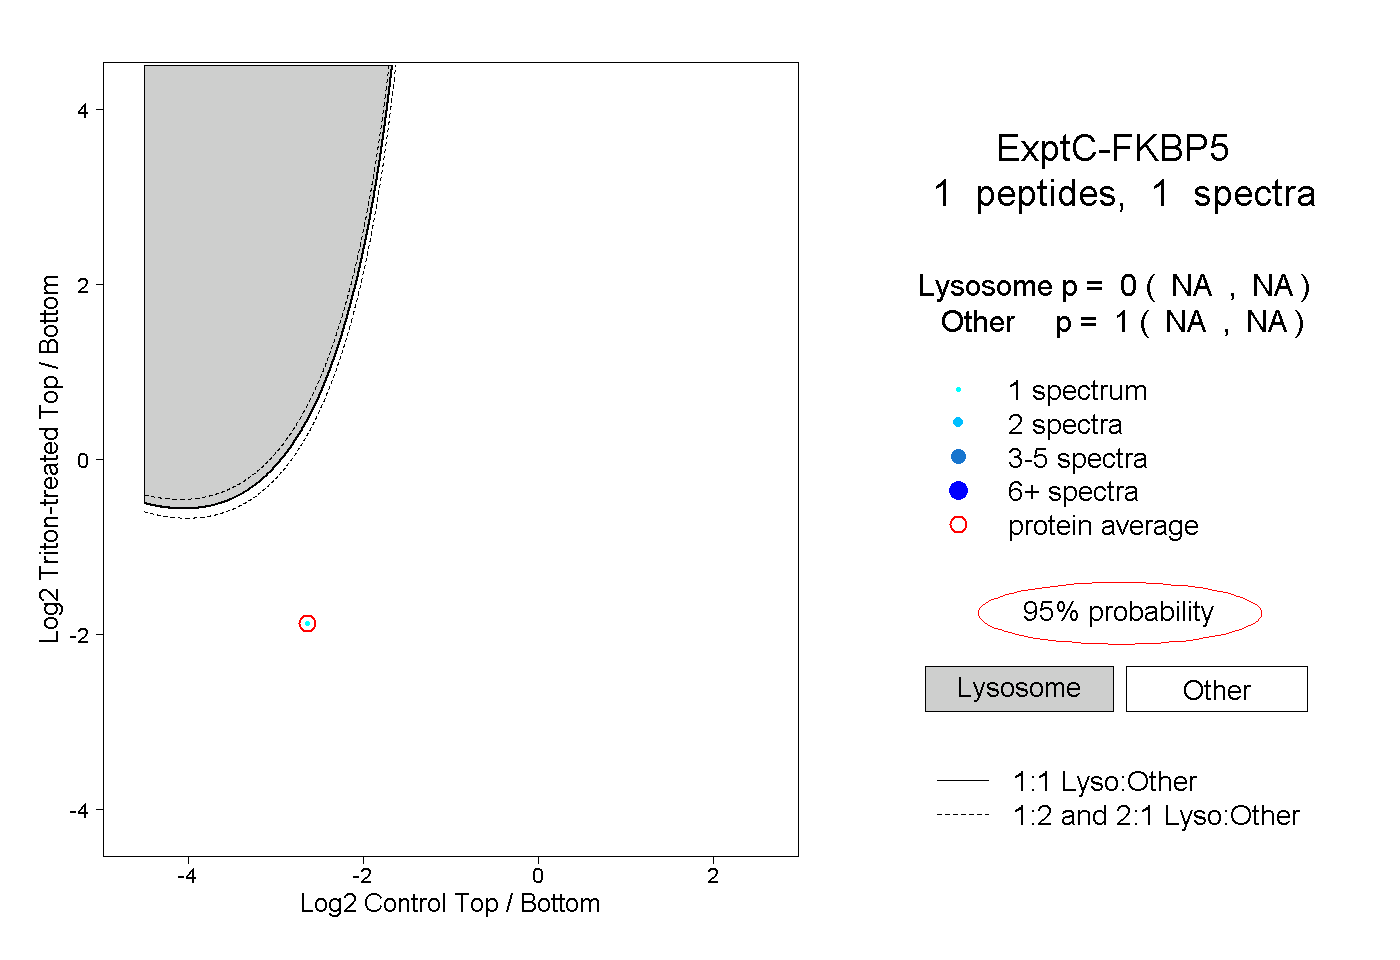 |
0.000 NA | NA |
1.000 NA | NA |