 2
2peptides
spectra
0.045 | 0.097
0.000 | 0.213
0.023 | 0.222
0.000 | 0.000
0.266 | 0.338
0.000 | 0.000
0.357 | 0.395
0.000 | 0.000
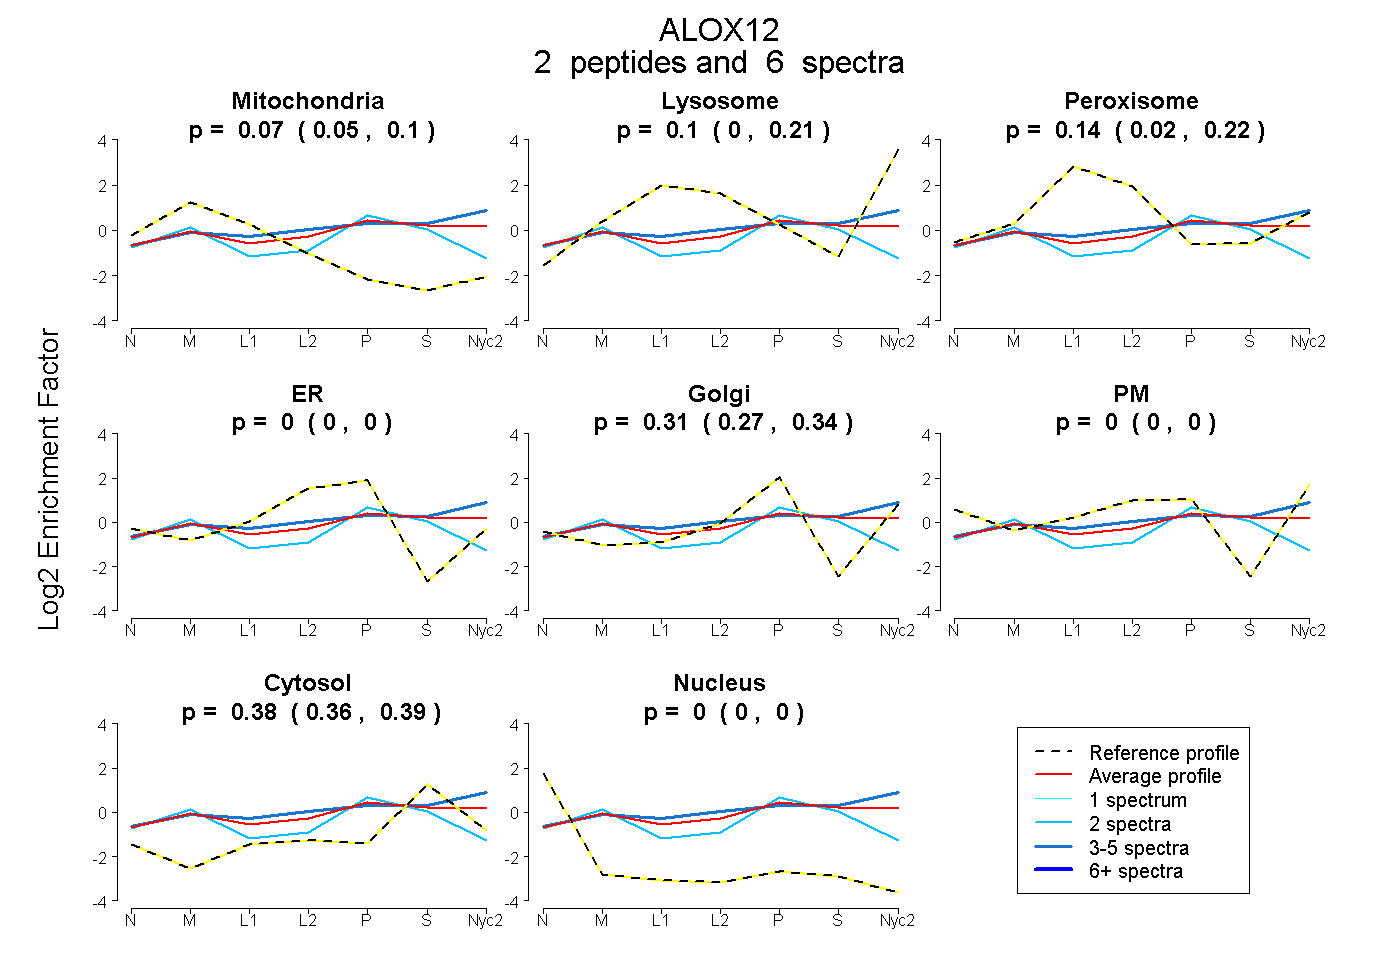
| Plot | Mito | Lyso | Perox | ER | Golgi | PM | Cytosol | Nucleus | |||||
| Expt A |
2 peptides |
6 spectra |
|
0.073 0.045 | 0.097 |
0.101 0.000 | 0.213 |
0.140 0.023 | 0.222 |
0.000 0.000 | 0.000 |
0.309 0.266 | 0.338 |
0.000 0.000 | 0.000 |
0.377 0.357 | 0.395 |
0.000 0.000 | 0.000 |
| 2 spectra, EITEVGLCHAQDR | 0.237 | 0.000 | 0.000 | 0.040 | 0.319 | 0.000 | 0.403 | 0.000 | ||
| 4 spectra, LLVPHIR | 0.008 | 0.243 | 0.099 | 0.000 | 0.154 | 0.105 | 0.392 | 0.000 |
| Plot | Mito | Lyso or Perox | ER | Golgi | PM | Cytosol | Nucleus | ||||||
| Expt B |
1 peptide |
1 spectrum |
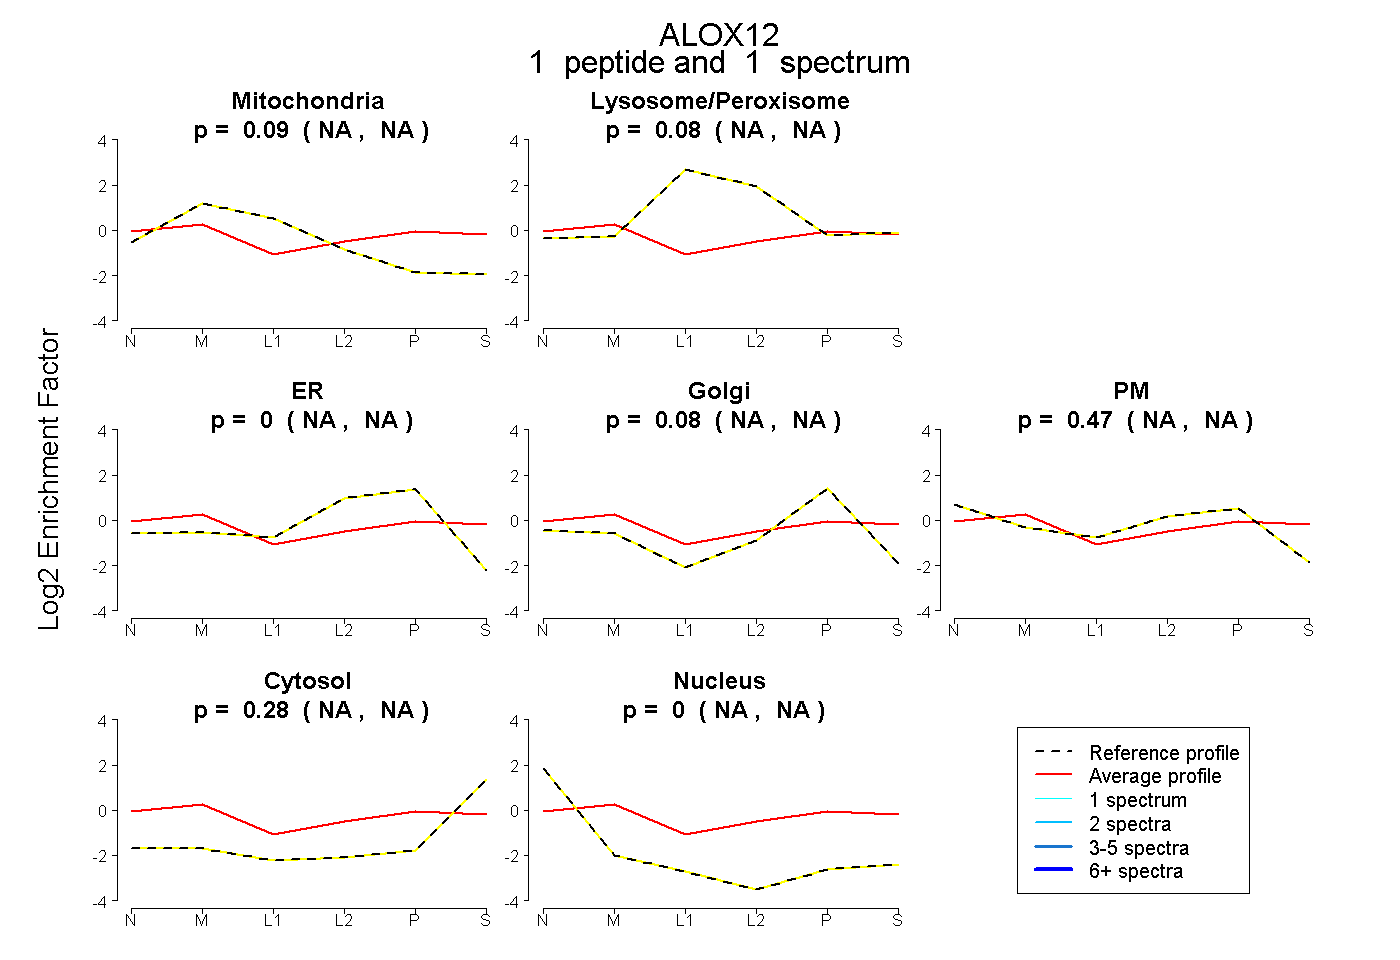 |
0.087 NA | NA |
0.085 NA | NA |
0.000 NA | NA |
0.080 NA | NA |
0.467 NA | NA |
0.281 NA | NA |
0.000 NA | NA |