 2
2peptides
spectra
0.310 | 0.495
0.000 | 0.125
0.044 | 0.224
0.000 | 0.000
0.137 | 0.279
0.000 | 0.000
0.083 | 0.268
0.000 | 0.000
2peptides
spectra
NA | NA
NA | NA
| Plot | Mito | Lyso | Perox | ER | Golgi | PM | Cytosol | Nucleus | |||||
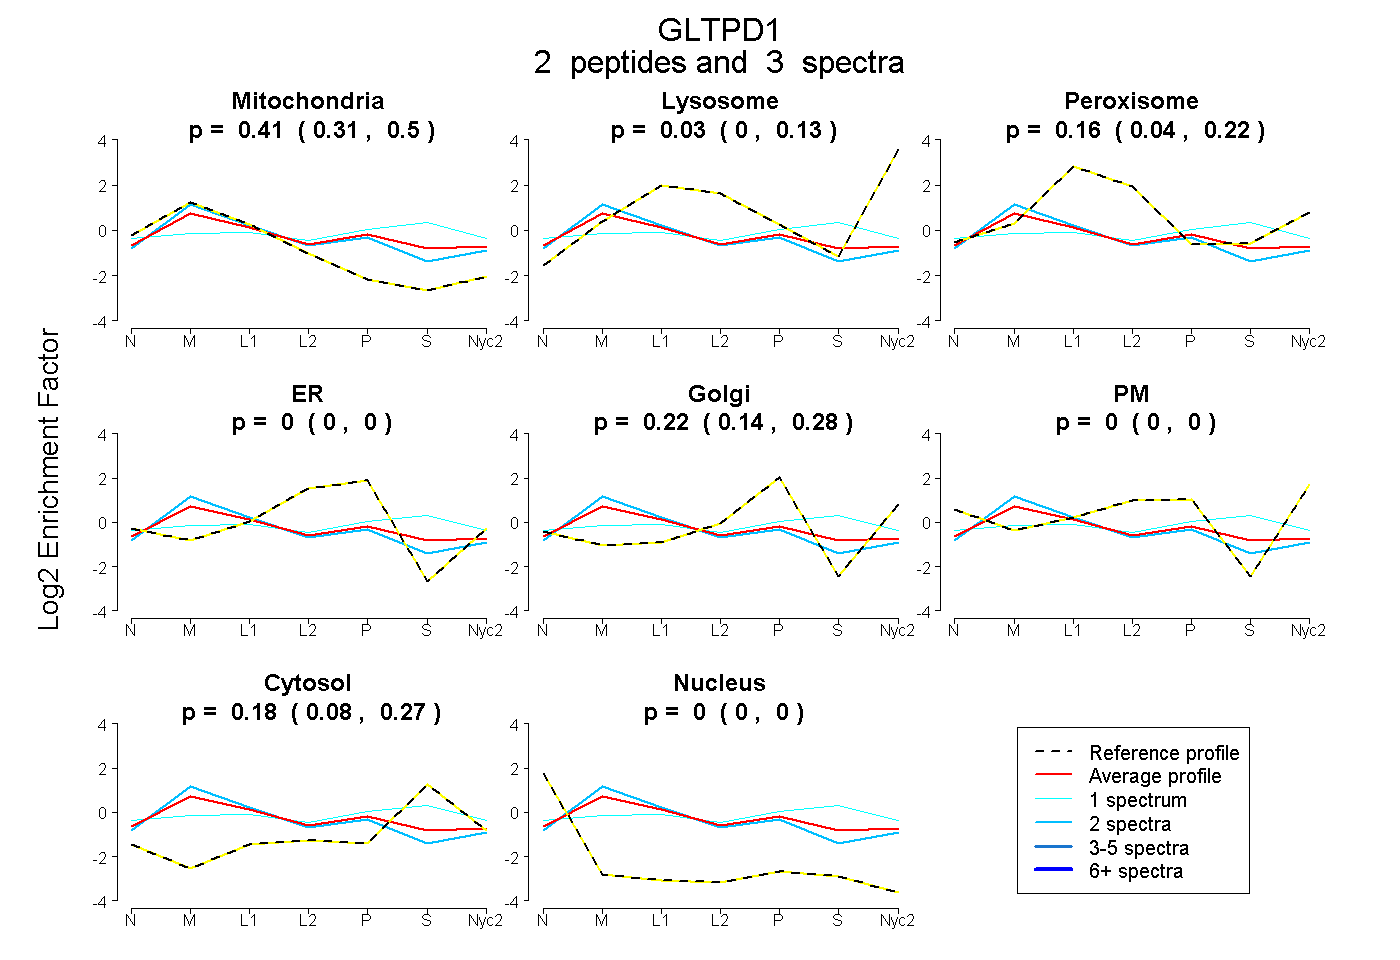
| Expt A |
2 peptides |
3 spectra |
|
0.406 0.310 | 0.495 |
0.033 0.000 | 0.125 |
0.162 0.044 | 0.224 |
0.000 0.000 | 0.000 |
0.216 0.137 | 0.279 |
0.000 0.000 | 0.000 |
0.183 0.083 | 0.268 |
0.000 0.000 | 0.000 |
||
| Plot | Lyso | Other | |||||||||||
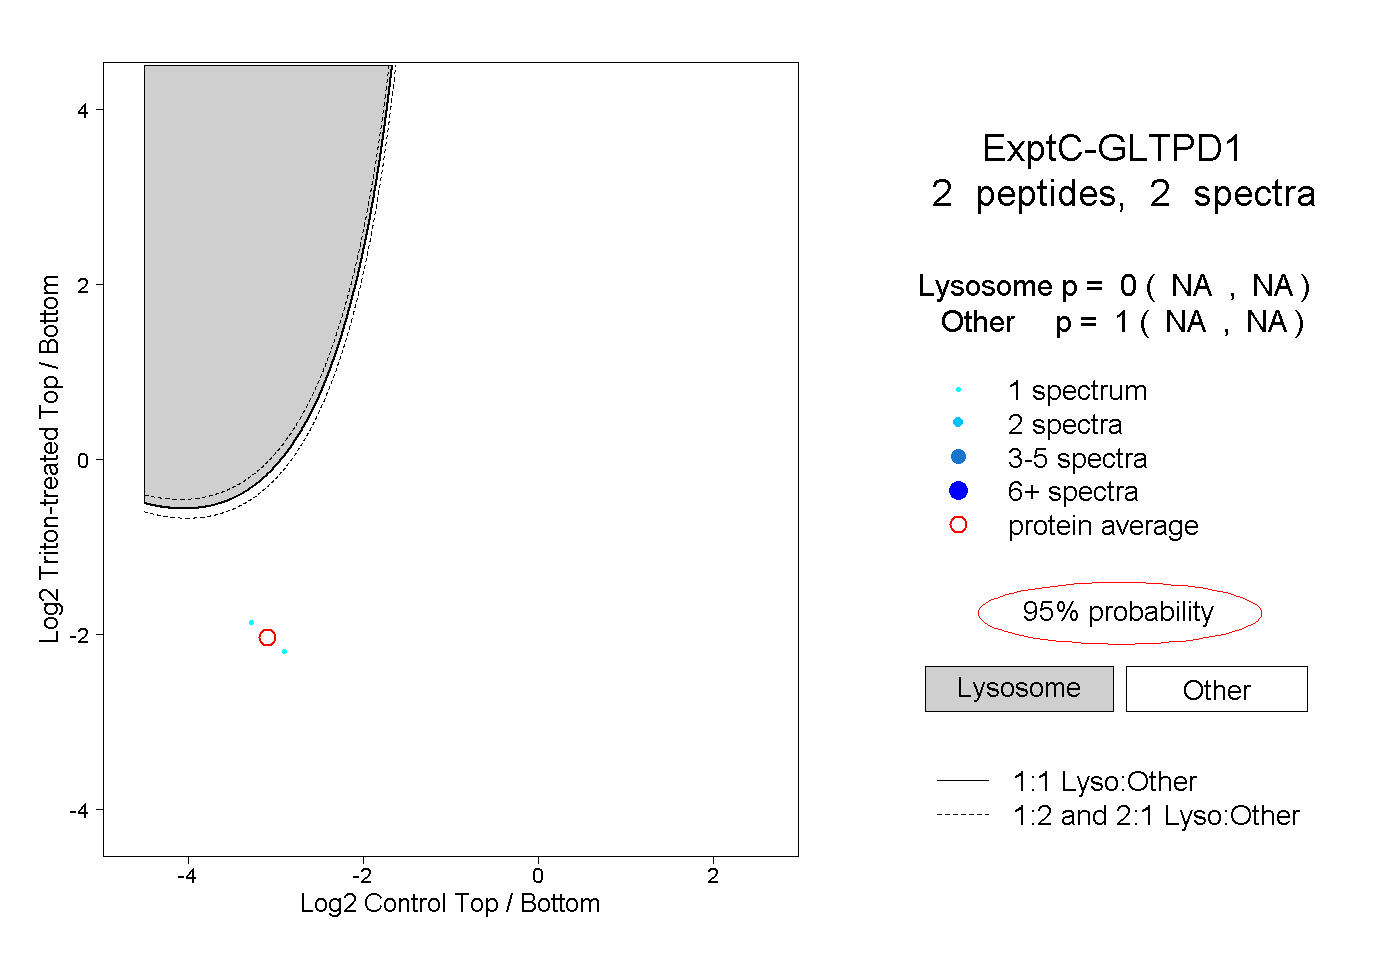
| Expt C |
2 peptides |
2 spectra |
|
0.000 NA | NA |
1.000 NA | NA |
| 1 spectrum, LYAEHSLLDLP | 0.000 | 1.000 | ||||||||
| 1 spectrum, LQIMEHLR | 0.000 | 1.000 |