 3
3peptides
spectra
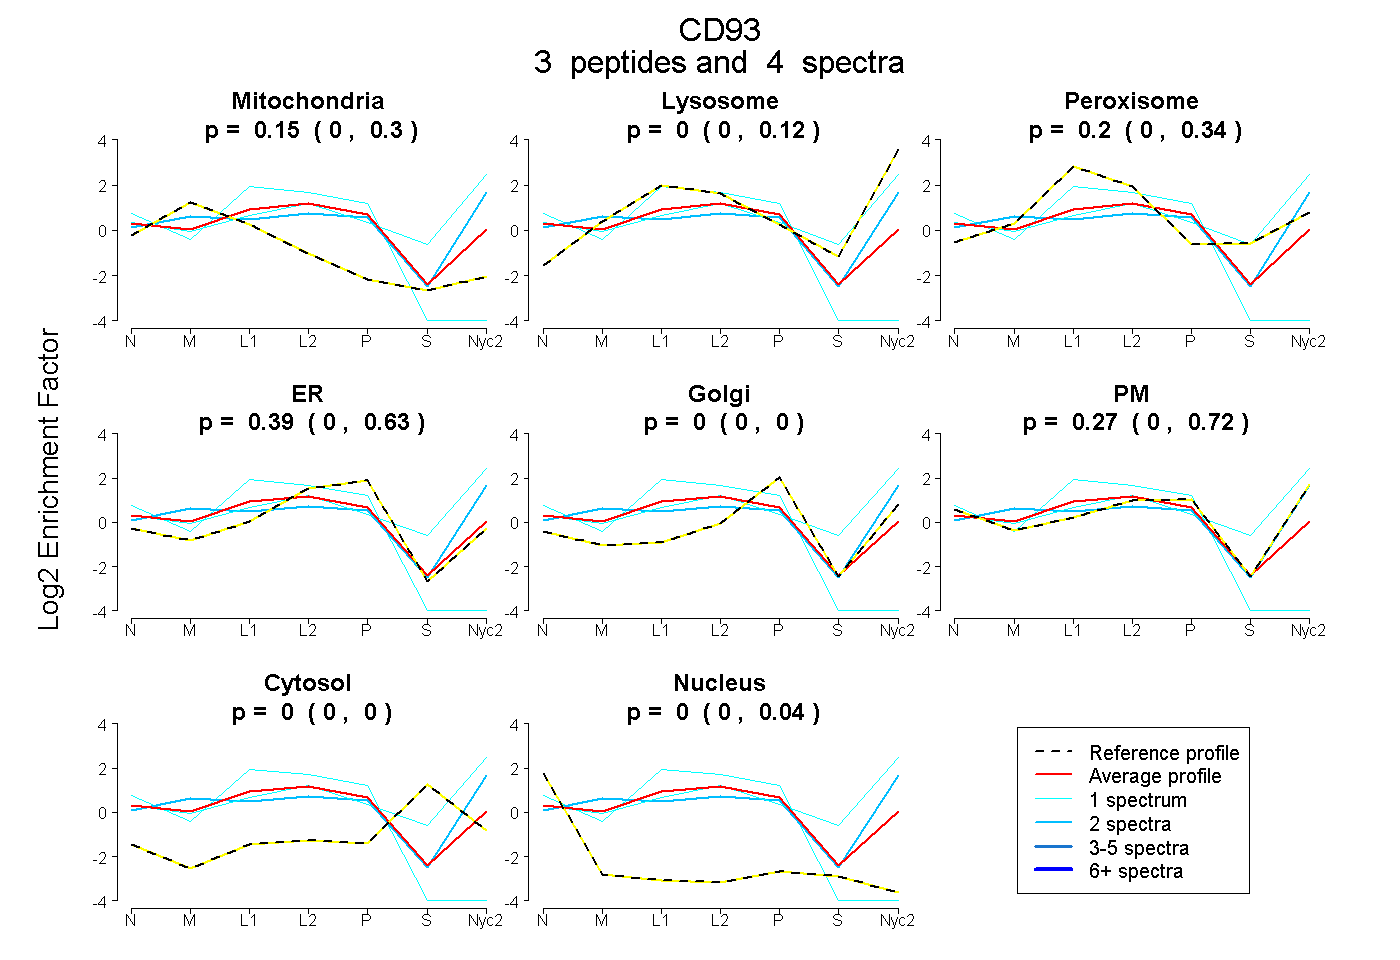
0.000 | 0.295
0.000 | 0.122
0.000 | 0.337
0.000 | 0.629
0.000 | 0.000
0.000 | 0.723
0.000 | 0.000
0.000 | 0.039
| Plot | Mito | Lyso | Perox | ER | Golgi | PM | Cytosol | Nucleus | |||||
| Expt A |
3 peptides |
4 spectra |
|
0.153 0.000 | 0.295 |
0.000 0.000 | 0.122 |
0.196 0.000 | 0.337 |
0.385 0.000 | 0.629 |
0.000 0.000 | 0.000 |
0.266 0.000 | 0.723 |
0.000 0.000 | 0.000 |
0.000 0.000 | 0.039 |
| 1 spectrum, LLDDLVTCASR | 0.000 | 0.366 | 0.083 | 0.000 | 0.000 | 0.448 | 0.104 | 0.000 | ||
| 1 spectrum, APENQYSPTPGTDC | 0.333 | 0.000 | 0.000 | 0.665 | 0.000 | 0.000 | 0.000 | 0.002 | ||
| 2 spectra, HVQEALAQLLK | 0.152 | 0.195 | 0.000 | 0.000 | 0.000 | 0.654 | 0.000 | 0.000 |
| Plot | Lyso | Other | |||||||||||
| Expt C |
2 peptides |
6 spectra |
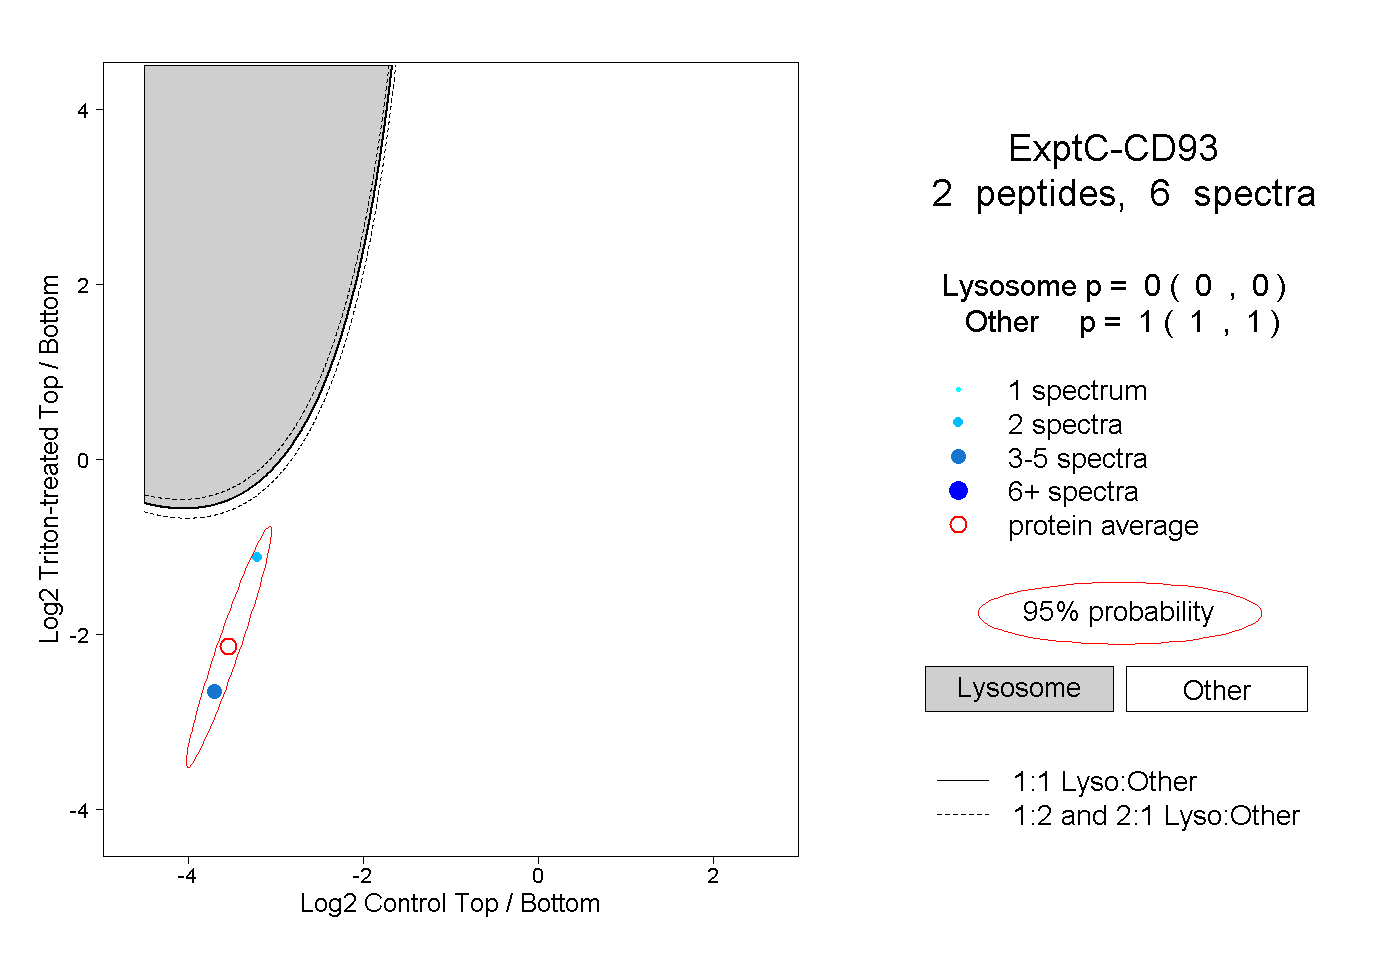 |
0.000 0.000 | 0.000 |
1.000 1.000 | 1.000 |