 1
1peptide
spectra
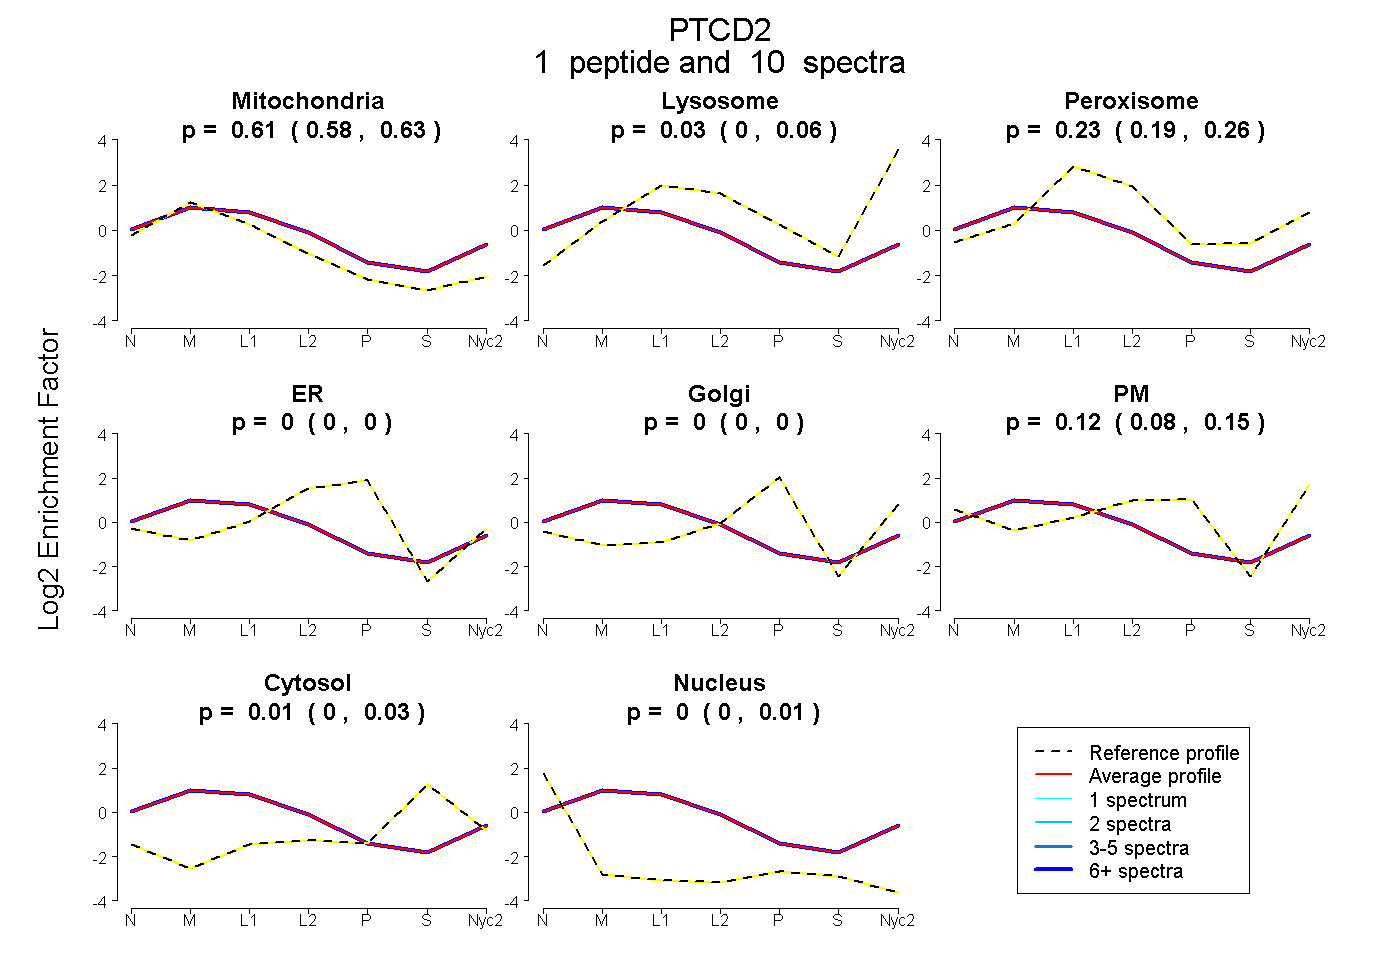
0.579 | 0.630
0.000 | 0.059
0.193 | 0.260
0.000 | 0.000
0.000 | 0.000
0.083 | 0.153
0.000 | 0.026
0.000 | 0.006
7peptides
spectra
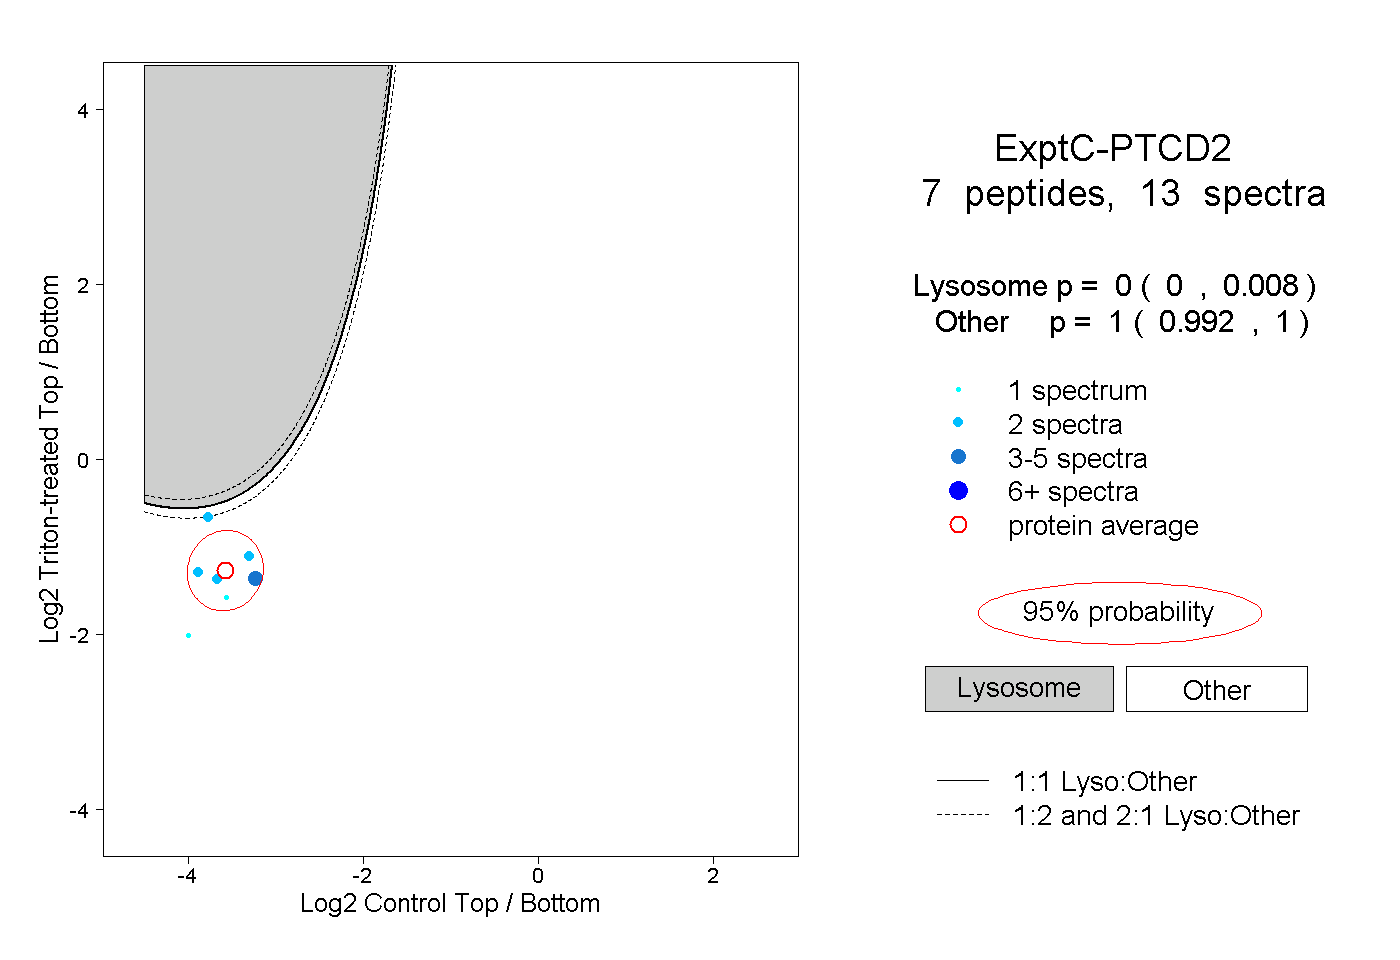
0.000 | 0.008
0.992 | 1.000
2peptides
spectra
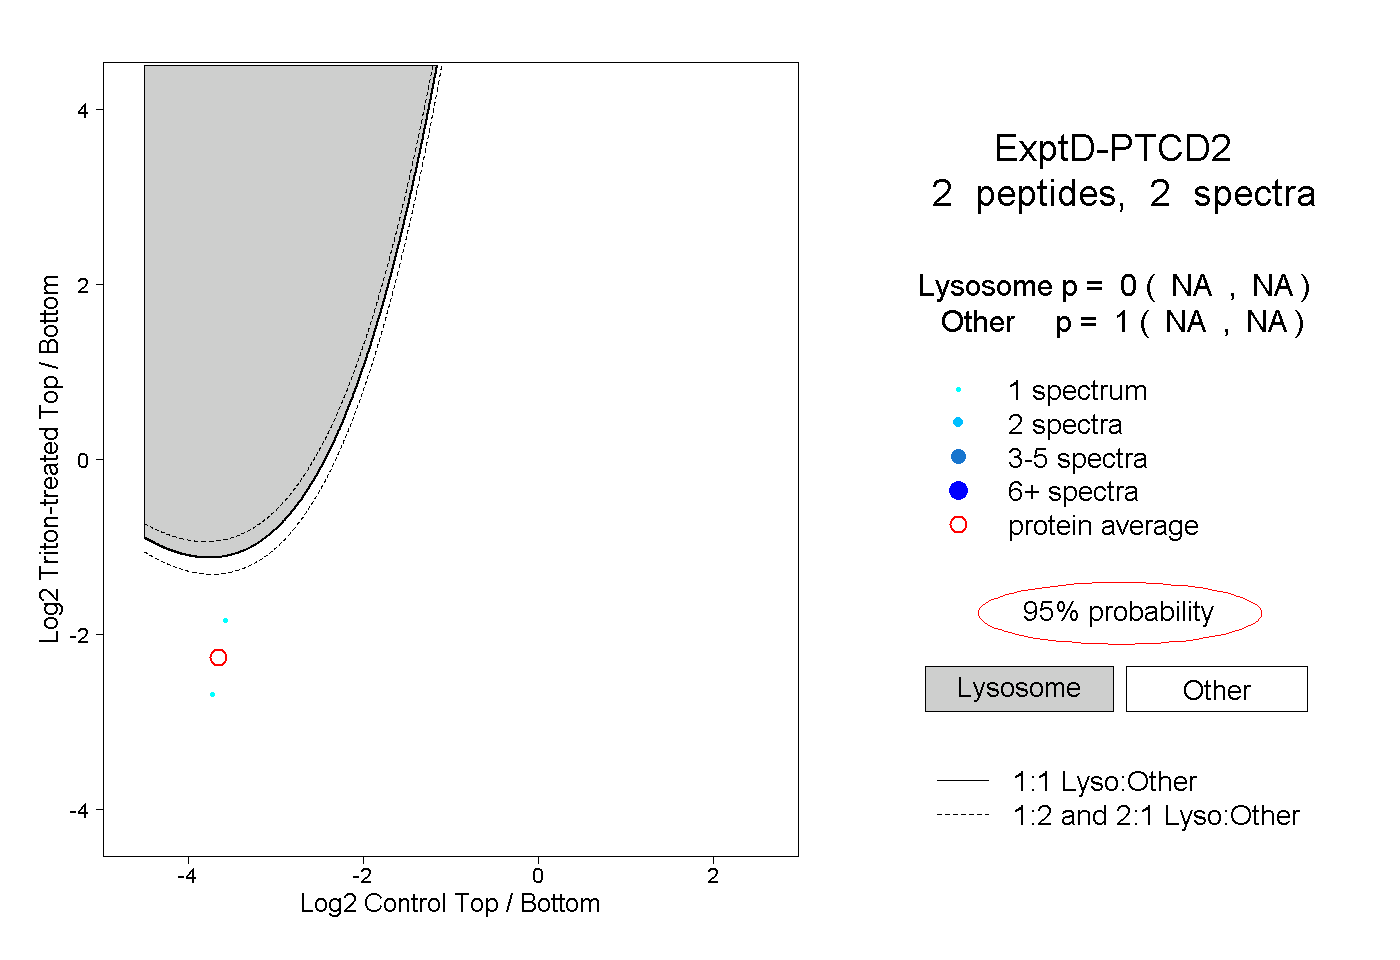
NA | NA
NA | NA