 5
5peptides
spectra
0.000 | 0.000
0.000 | 0.000
0.000 | 0.000
0.584 | 0.697
0.170 | 0.298
0.000 | 0.000
0.000 | 0.122
0.019 | 0.089
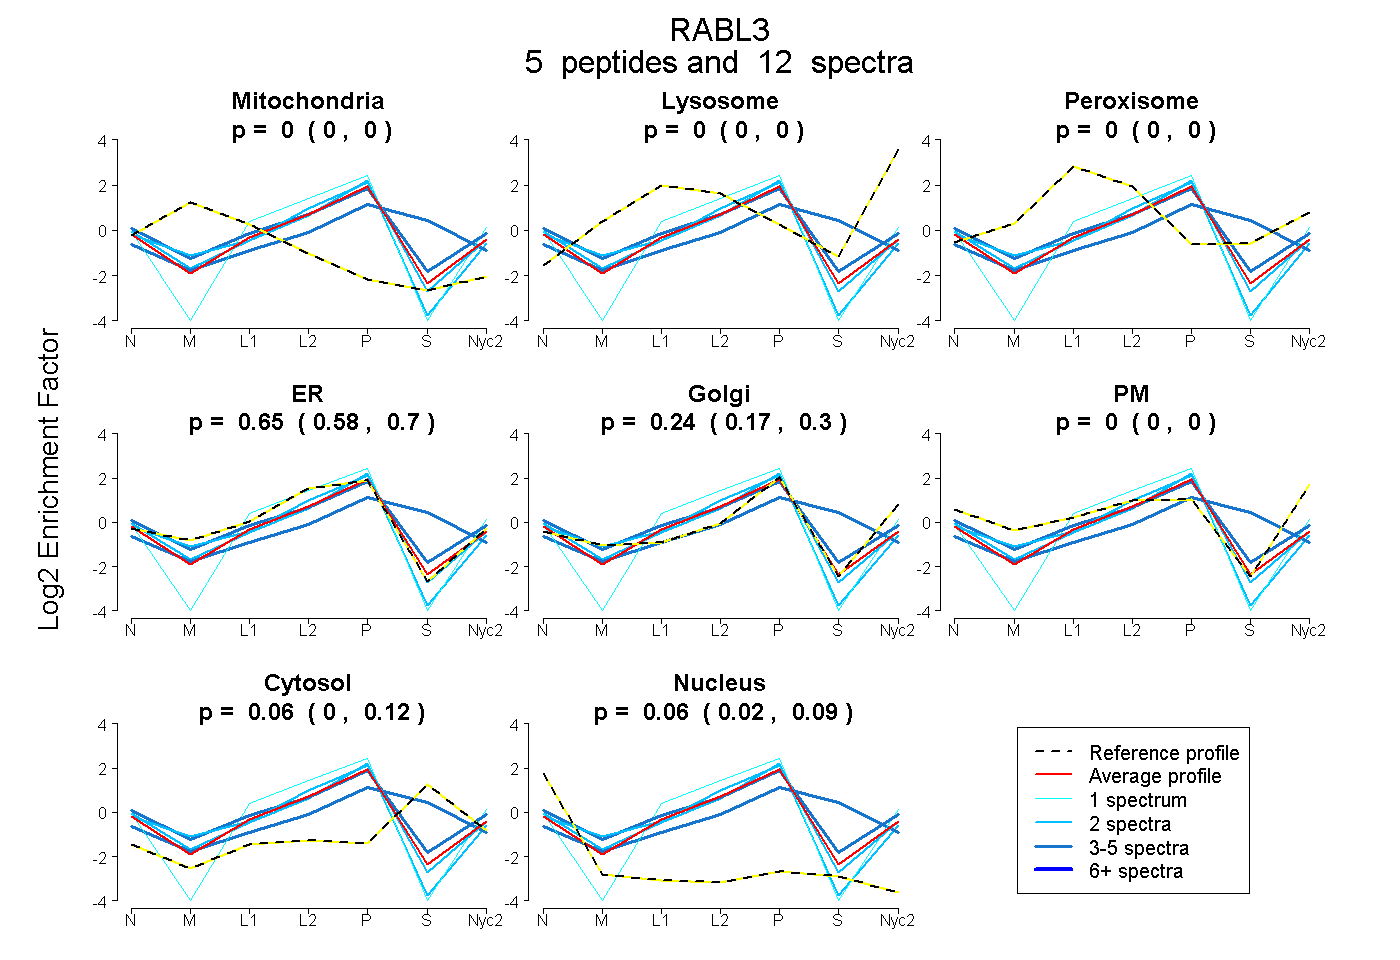
| Plot | Mito | Lyso | Perox | ER | Golgi | PM | Cytosol | Nucleus | |||||
| Expt A |
5 peptides |
12 spectra |
|
0.000 0.000 | 0.000 |
0.000 0.000 | 0.000 |
0.000 0.000 | 0.000 |
0.646 0.584 | 0.697 |
0.239 0.170 | 0.298 |
0.000 0.000 | 0.000 |
0.055 0.000 | 0.122 |
0.059 0.019 | 0.089 |
| 2 spectra, EGNQIPGFSDR | 0.000 | 0.000 | 0.000 | 0.707 | 0.200 | 0.000 | 0.000 | 0.094 | ||
| 4 spectra, SSQNLYR | 0.000 | 0.000 | 0.000 | 0.603 | 0.239 | 0.042 | 0.112 | 0.005 | ||
| 2 spectra, WSLEVLNR | 0.000 | 0.000 | 0.000 | 0.747 | 0.208 | 0.000 | 0.000 | 0.045 | ||
| 1 spectrum, LDQIHETK | 0.000 | 0.000 | 0.000 | 0.852 | 0.120 | 0.000 | 0.000 | 0.029 | ||
| 3 spectra, EGTPEEK | 0.000 | 0.000 | 0.000 | 0.394 | 0.048 | 0.000 | 0.558 | 0.000 |
| Plot | Mito | Lyso or Perox | ER | Golgi | PM | Cytosol | Nucleus | ||||||
| Expt B |
1 peptide |
2 spectra |
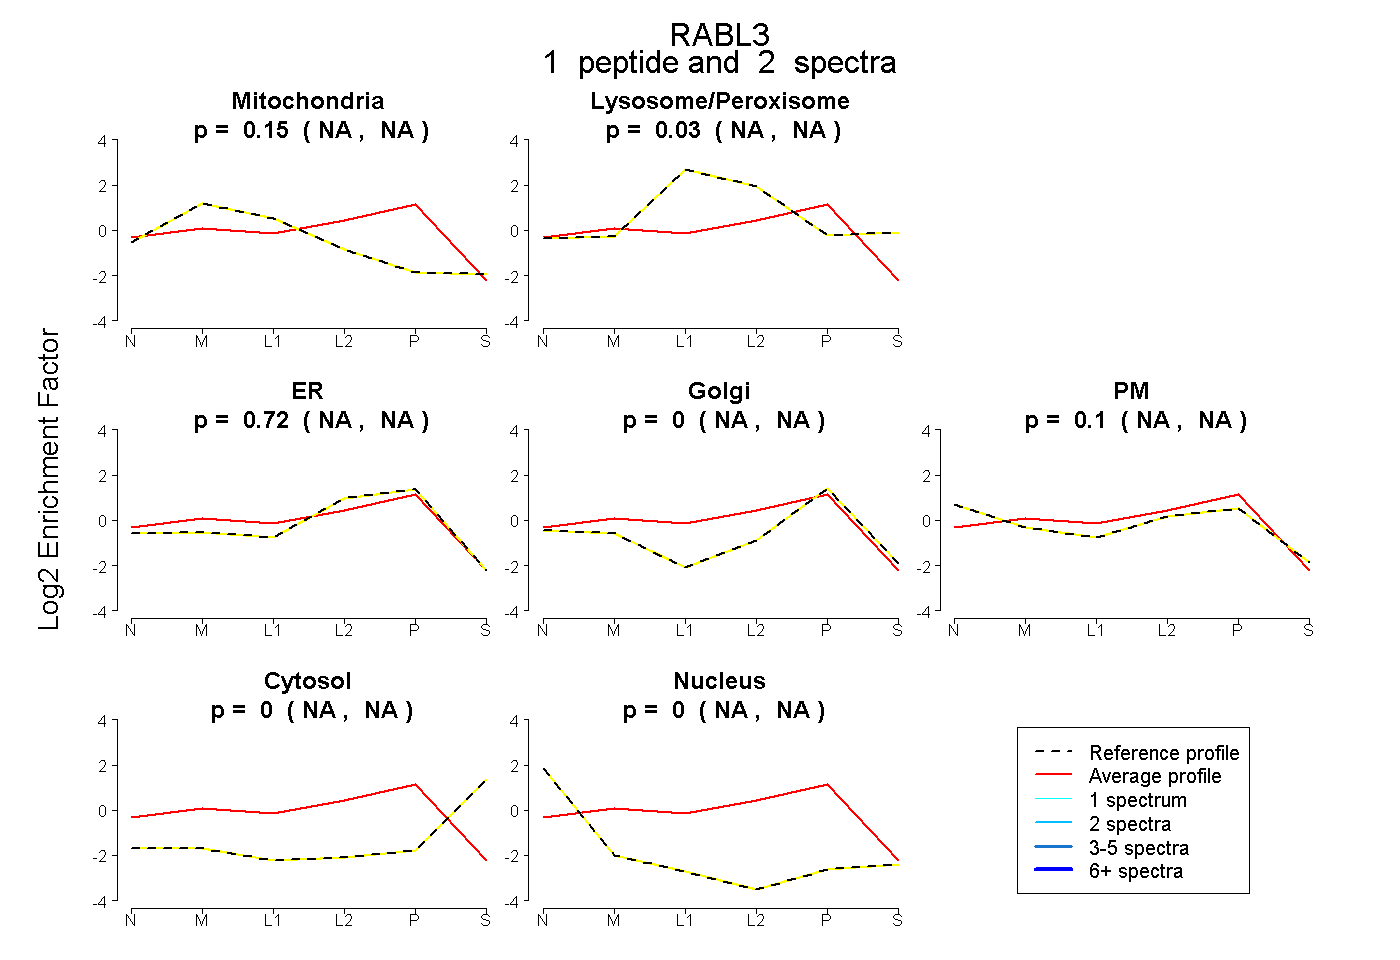 |
0.154 NA | NA |
0.029 NA | NA |
0.719 NA | NA |
0.000 NA | NA |
0.098 NA | NA |
0.000 NA | NA |
0.000 NA | NA |
|||
| Plot | Lyso | Other | |||||||||||
| Expt C |
5 peptides |
24 spectra |
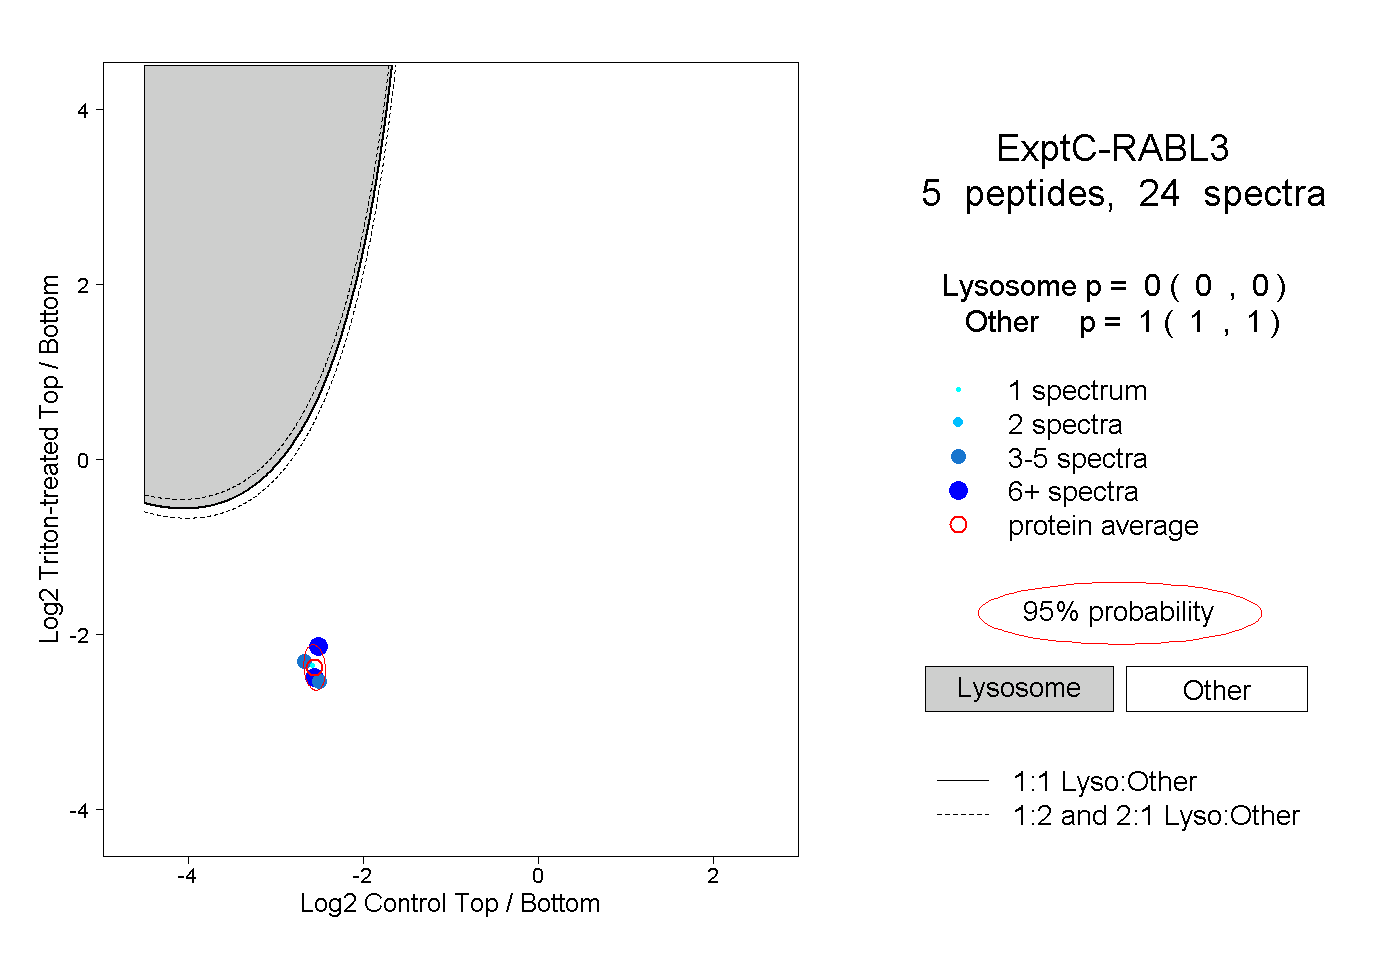 |
0.000 0.000 | 0.000 |
1.000 1.000 | 1.000 |
||||||||
| Plot | Lyso | Other | |||||||||||
| Expt D |
3 peptides |
4 spectra |
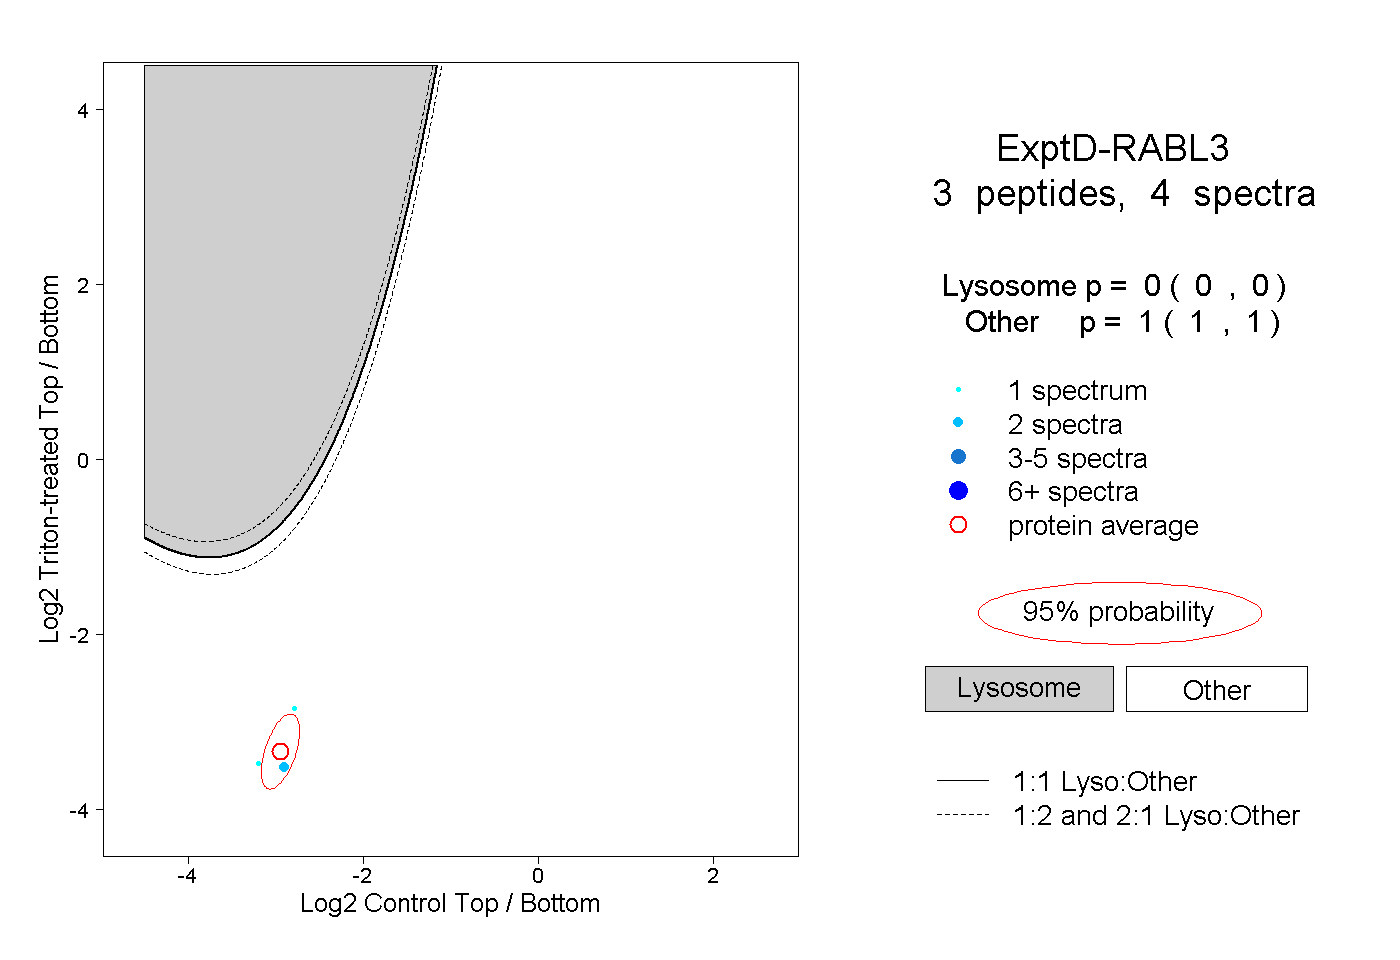 |
0.000 0.000 | 0.000 |
1.000 1.000 | 1.000 |