 1
1peptide
spectra
0.000 | 0.000
0.154 | 0.211
0.000 | 0.000
0.000 | 0.154
0.118 | 0.294
0.364 | 0.475
0.073 | 0.116
0.000 | 0.000
1peptide
spectra
0.073 | 1.000
0.000 | 0.926
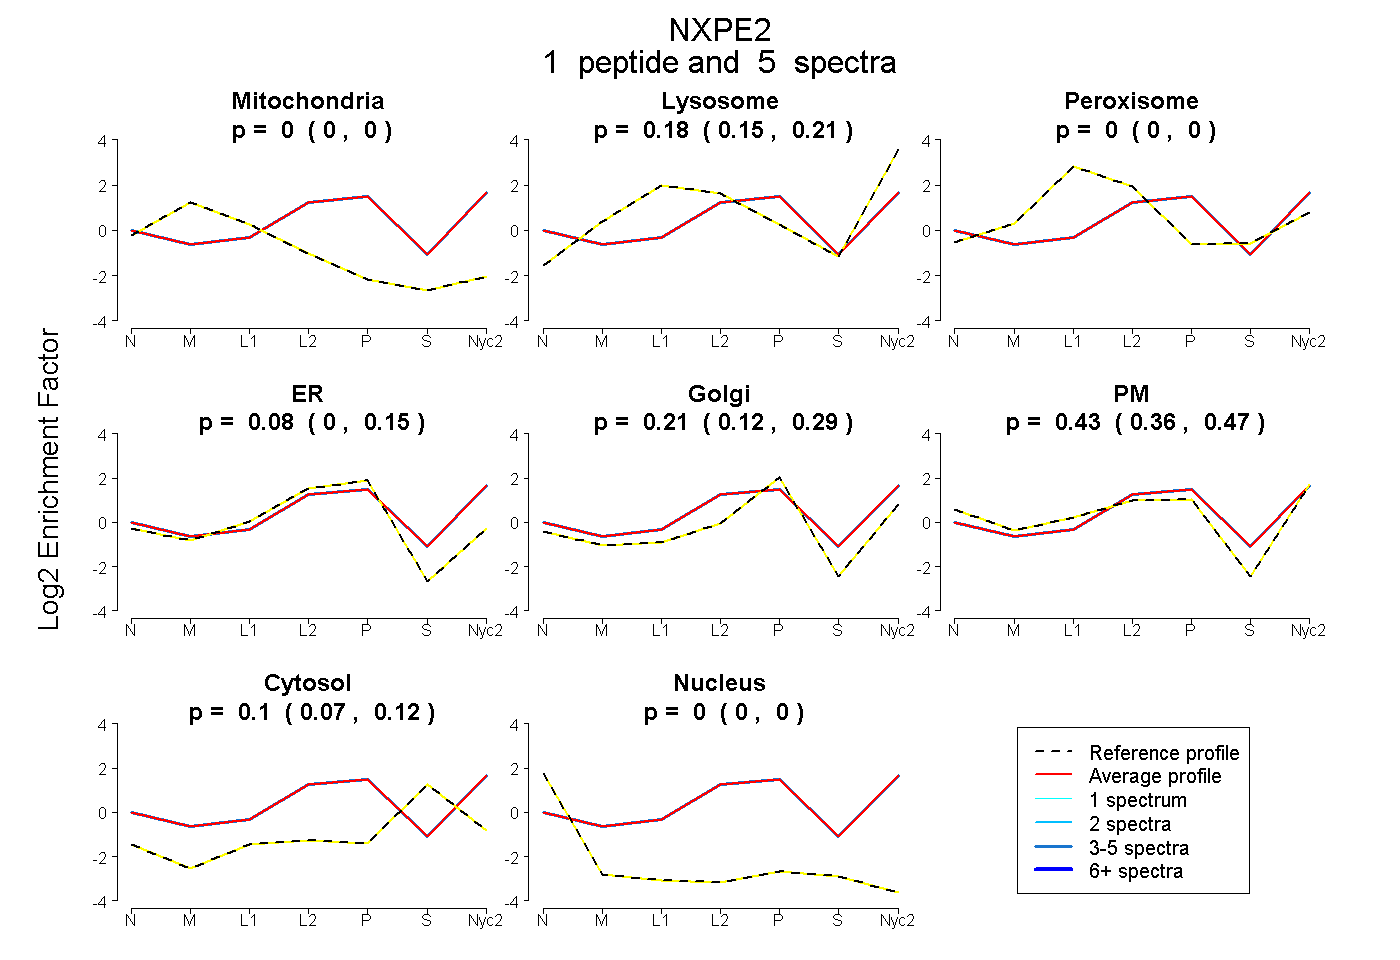
| Plot | Mito | Lyso | Perox | ER | Golgi | PM | Cytosol | Nucleus | |||||
| Expt A |
1 peptide |
5 spectra |
|
0.000 0.000 | 0.000 |
0.185 0.154 | 0.211 |
0.000 0.000 | 0.000 |
0.078 0.000 | 0.154 |
0.215 0.118 | 0.294 |
0.425 0.364 | 0.475 |
0.097 0.073 | 0.116 |
0.000 0.000 | 0.000 |
||
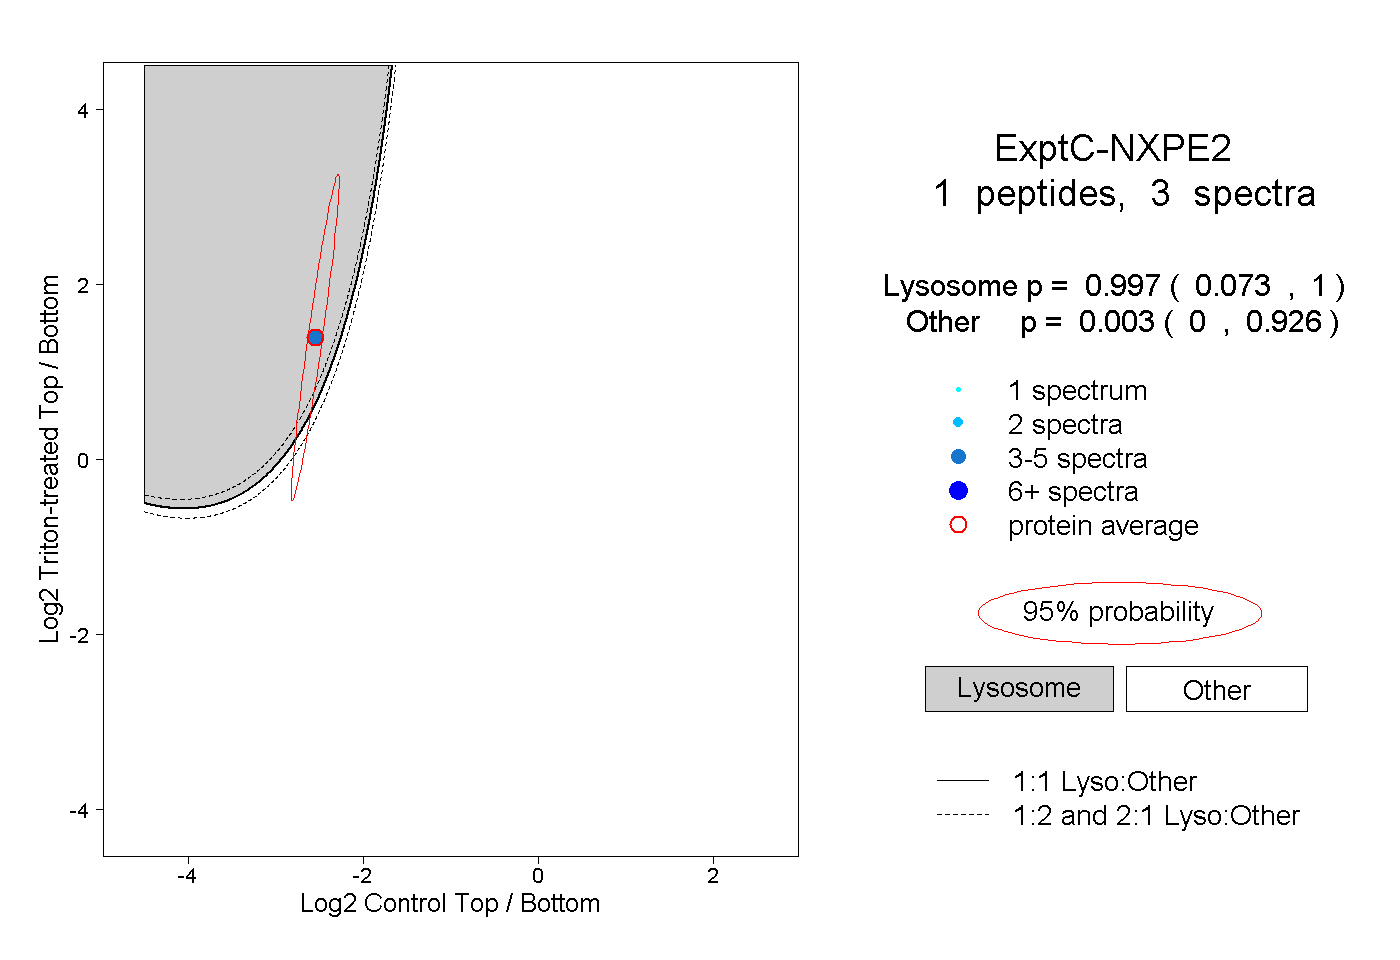
| Plot | Lyso | Other | |||||||||||
| Expt C |
1 peptide |
3 spectra |
|
0.997 0.073 | 1.000 |
0.003 0.000 | 0.926 |