 4
4peptides
spectra
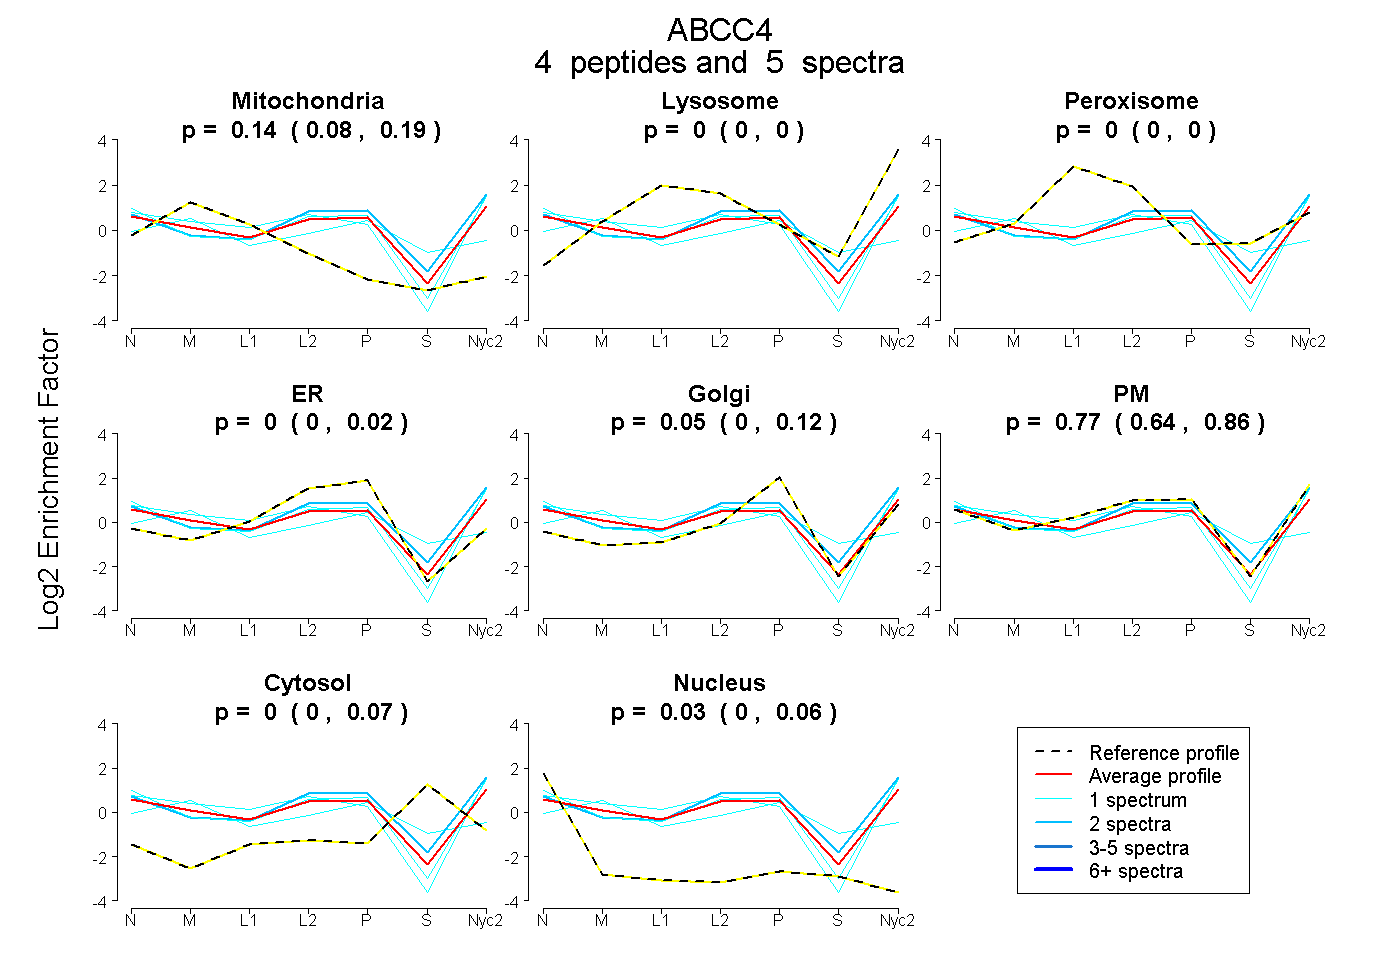
0.077 | 0.188
0.000 | 0.000
0.000 | 0.000
0.000 | 0.025
0.000 | 0.119
0.643 | 0.855
0.000 | 0.067
0.000 | 0.058
1peptide
spectrum
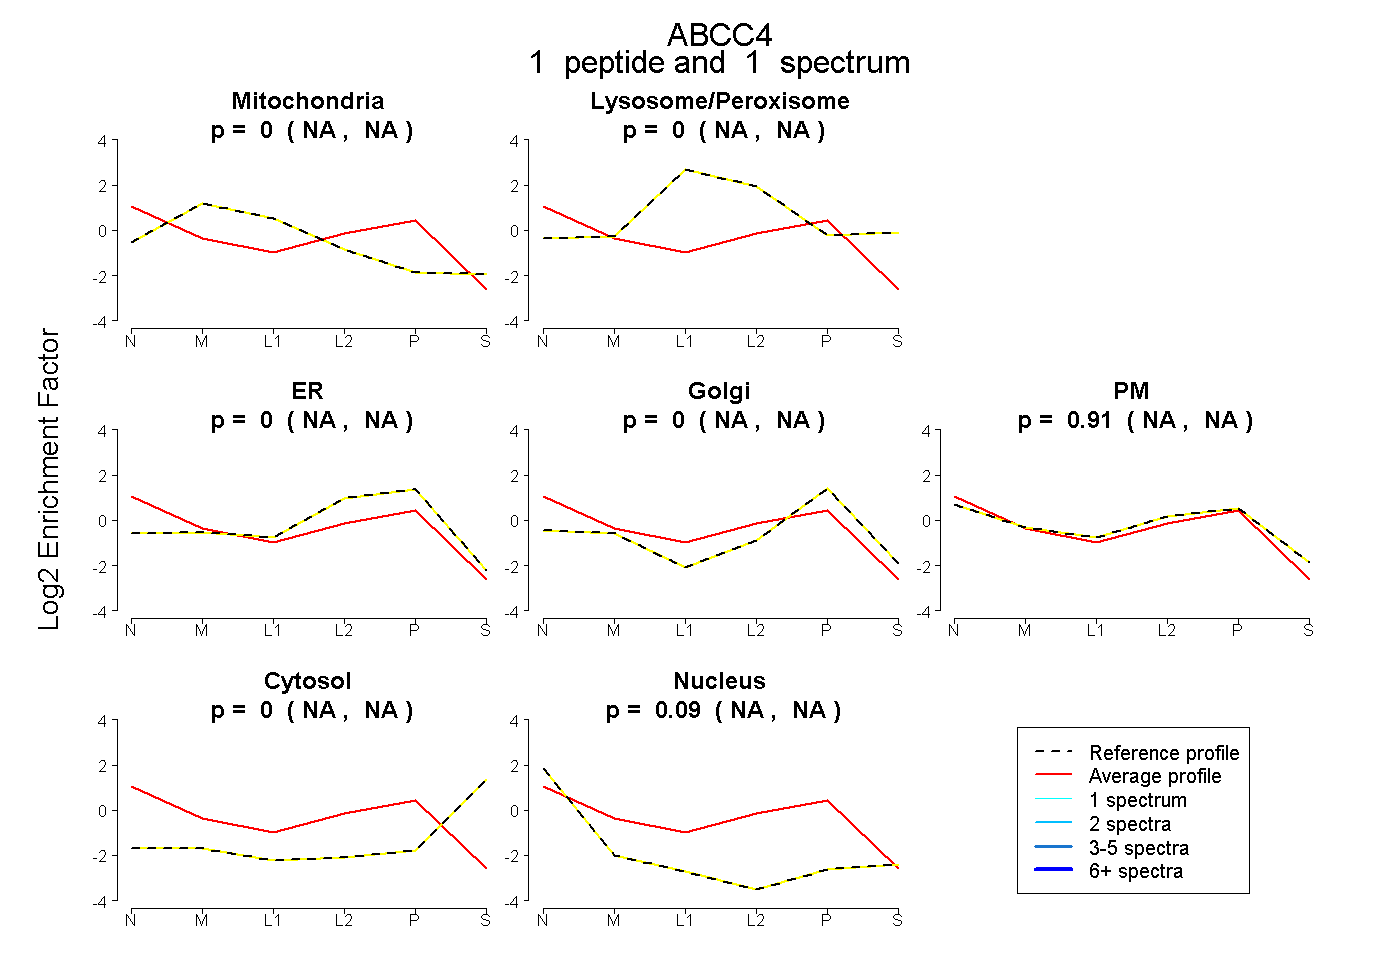
NA | NA
NA | NA
NA | NA
NA | NA
NA | NA
NA | NA
NA | NA
6peptides
spectra
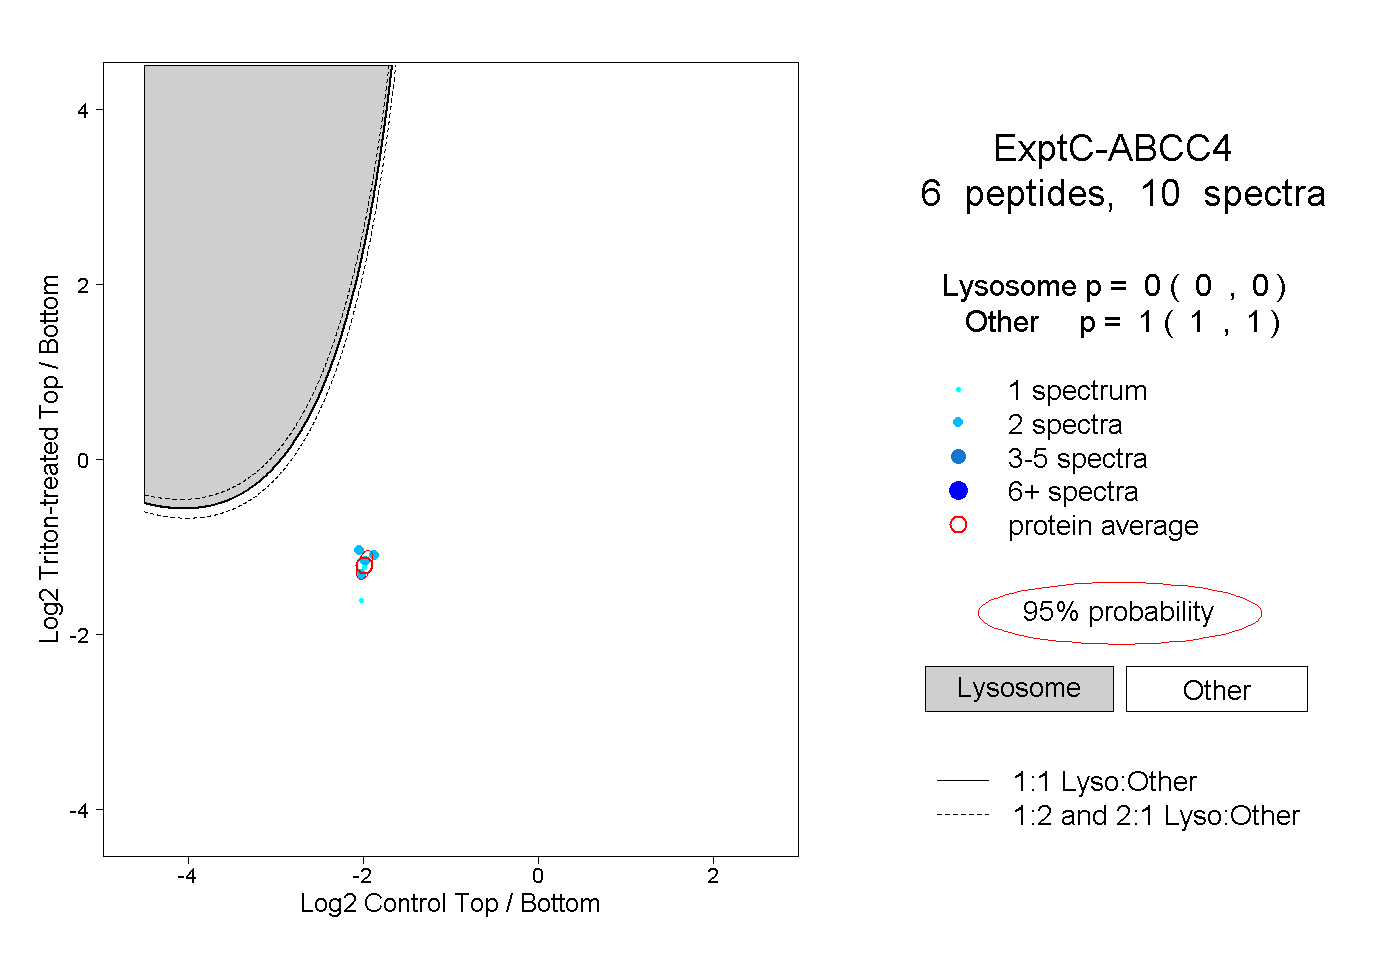
0.000 | 0.000
1.000 | 1.000