 8
8peptides
spectra
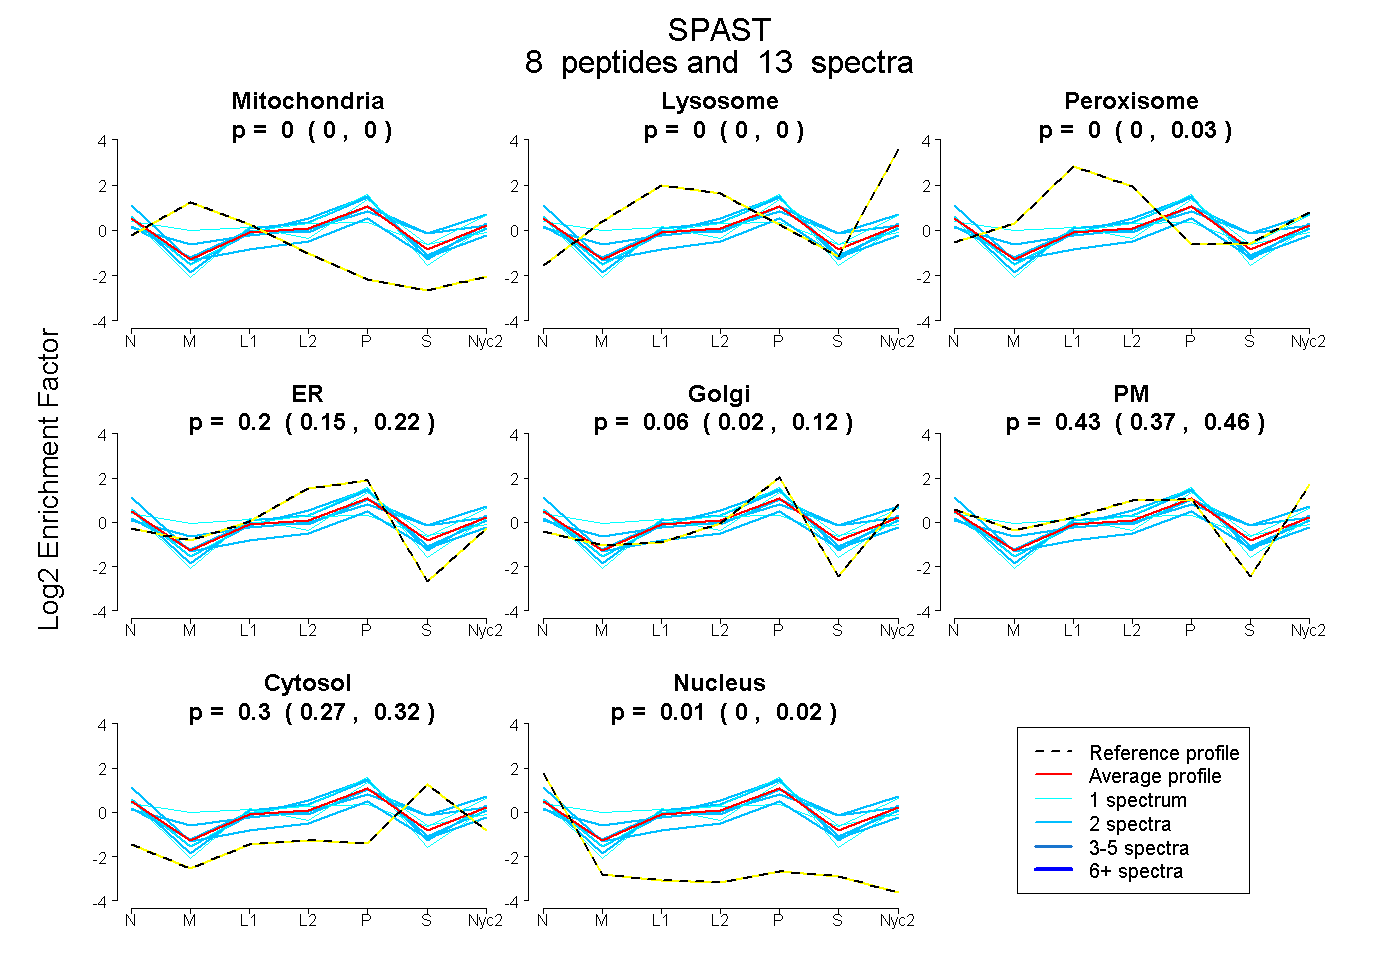
0.000 | 0.000
0.000 | 0.000
0.000 | 0.030
0.148 | 0.225
0.017 | 0.121
0.371 | 0.457
0.265 | 0.316
0.000 | 0.023
| Plot | Mito | Lyso | Perox | ER | Golgi | PM | Cytosol | Nucleus | |||||
| Expt A |
8 peptides |
13 spectra |
|
0.000 0.000 | 0.000 |
0.000 0.000 | 0.000 |
0.000 0.000 | 0.030 |
0.196 0.148 | 0.225 |
0.061 0.017 | 0.121 |
0.433 0.371 | 0.457 |
0.300 0.265 | 0.316 |
0.010 0.000 | 0.023 |
| 1 spectrum, VLVMGATNRPQELDEAVLR | 0.000 | 0.000 | 0.000 | 0.345 | 0.187 | 0.286 | 0.142 | 0.040 | ||
| 2 spectra, ELAQLAR | 0.000 | 0.000 | 0.191 | 0.000 | 0.290 | 0.200 | 0.319 | 0.000 | ||
| 2 spectra, SVSPQTLEAYIR | 0.000 | 0.000 | 0.000 | 0.382 | 0.078 | 0.282 | 0.247 | 0.011 | ||
| 2 spectra, EQAVEWYK | 0.000 | 0.000 | 0.120 | 0.000 | 0.231 | 0.323 | 0.325 | 0.000 | ||
| 2 spectra, VYVSLPNEETR | 0.000 | 0.000 | 0.000 | 0.023 | 0.101 | 0.481 | 0.195 | 0.200 | ||
| 2 spectra, DAALGPIR | 0.000 | 0.000 | 0.000 | 0.333 | 0.119 | 0.341 | 0.202 | 0.004 | ||
| 1 spectrum, TNKPSTPTTAVR | 0.000 | 0.000 | 0.056 | 0.198 | 0.287 | 0.124 | 0.311 | 0.023 | ||
| 1 spectrum, GIAVIVTGQGEQYER | 0.068 | 0.000 | 0.166 | 0.000 | 0.000 | 0.535 | 0.232 | 0.000 |
| Plot | Lyso | Other | |||||||||||
| Expt C |
7 peptides |
16 spectra |
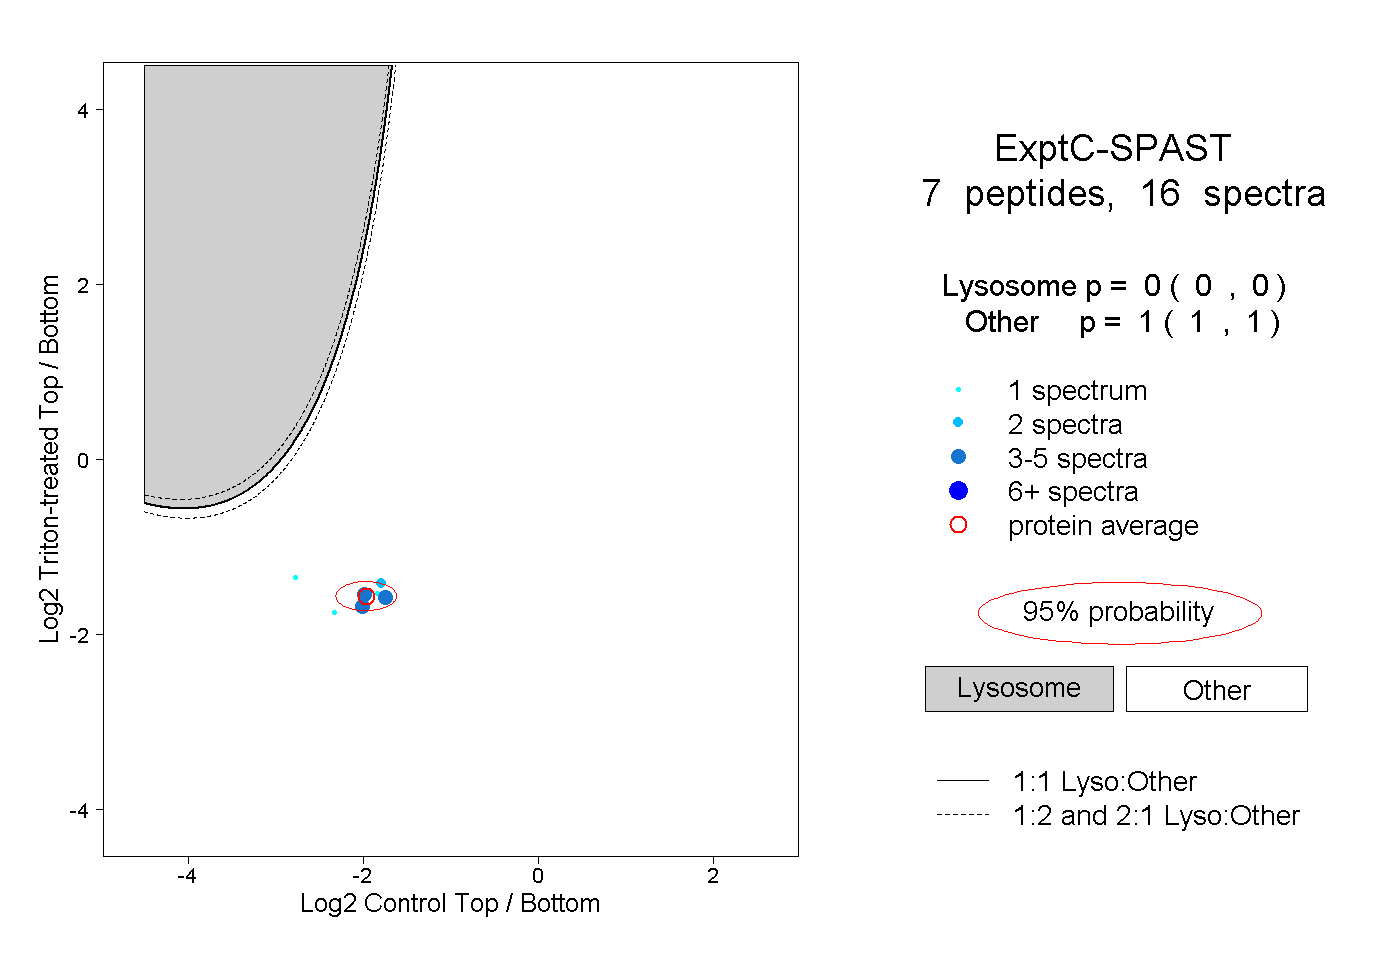 |
0.000 0.000 | 0.000 |
1.000 1.000 | 1.000 |