 6
6peptides
spectra
0.699 | 0.713
0.027 | 0.058
0.000 | 0.000
0.000 | 0.000
0.000 | 0.000
0.232 | 0.264
0.000 | 0.000
0.000 | 0.000
| Plot | Mito | Lyso | Perox | ER | Golgi | PM | Cytosol | Nucleus | |||||
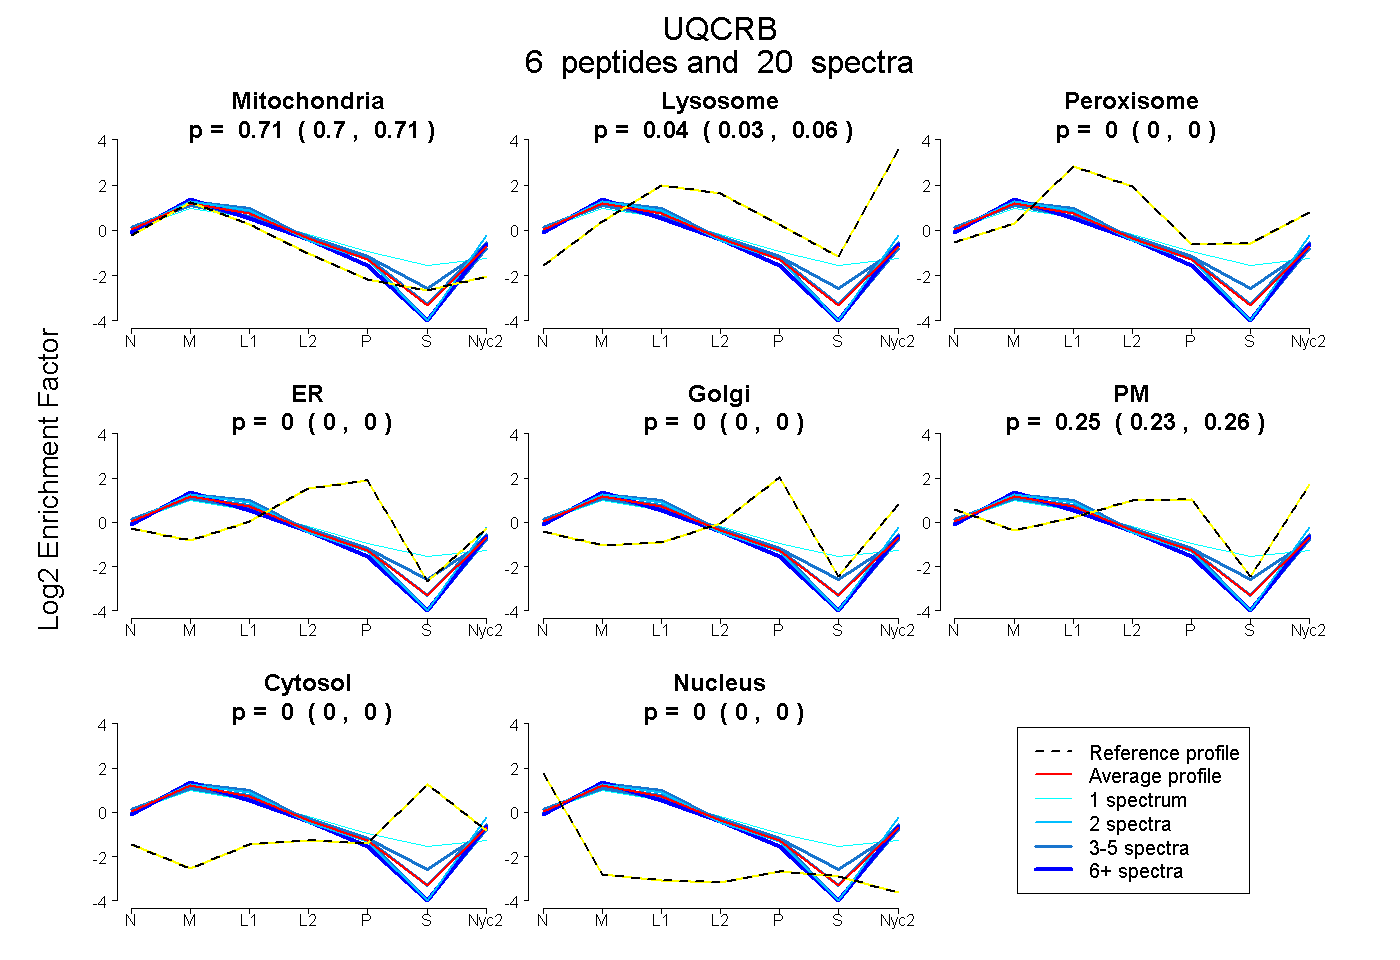
| Expt A |
6 peptides |
20 spectra |
|
0.707 0.699 | 0.713 |
0.044 0.027 | 0.058 |
0.000 0.000 | 0.000 |
0.000 0.000 | 0.000 |
0.000 0.000 | 0.000 |
0.249 0.232 | 0.264 |
0.000 0.000 | 0.000 |
0.000 0.000 | 0.000 |
| 3 spectra, LPENLYNDR | 0.678 | 0.047 | 0.000 | 0.000 | 0.000 | 0.275 | 0.000 | 0.000 | ||
| 3 spectra, HQILPK | 0.664 | 0.000 | 0.080 | 0.000 | 0.000 | 0.257 | 0.000 | 0.000 | ||
| 1 spectrum, DDTMHETEDVK | 0.604 | 0.000 | 0.208 | 0.090 | 0.032 | 0.016 | 0.050 | 0.000 | ||
| 2 spectra, WYYNAAGFNK | 0.671 | 0.059 | 0.000 | 0.000 | 0.000 | 0.270 | 0.000 | 0.000 | ||
| 8 spectra, WLDGFR | 0.742 | 0.013 | 0.000 | 0.000 | 0.000 | 0.245 | 0.000 | 0.000 | ||
| 3 spectra, ALDLSMR | 0.720 | 0.012 | 0.000 | 0.000 | 0.000 | 0.268 | 0.000 | 0.000 |
| Plot | Mito | Lyso or Perox | ER | Golgi | PM | Cytosol | Nucleus | ||||||
| Expt B |
3 peptides |
10 spectra |
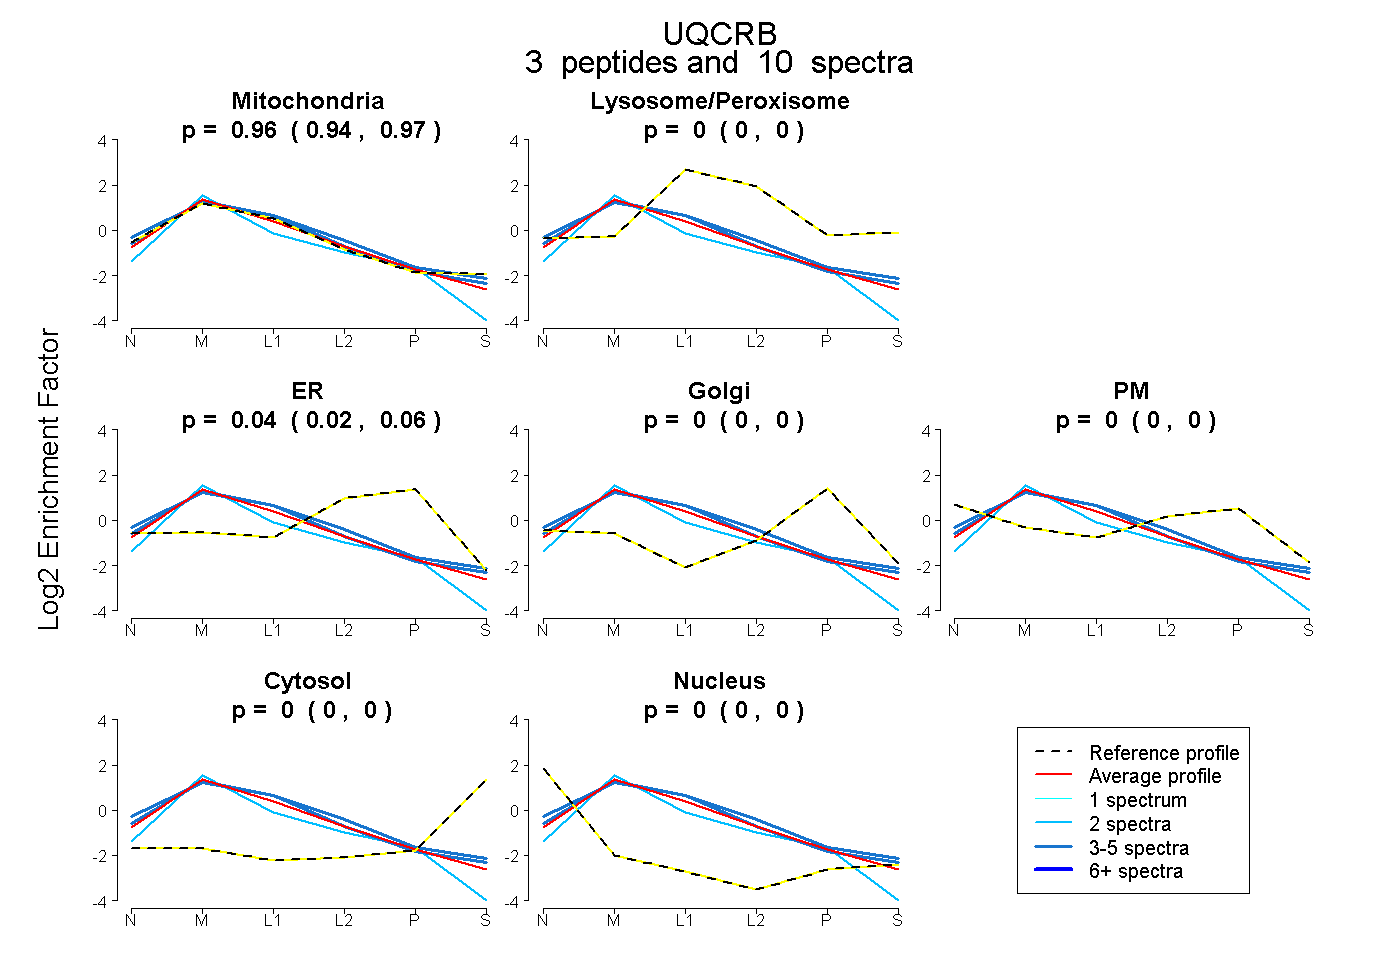 |
0.957 0.939 | 0.971 |
0.000 0.000 | 0.000 |
0.043 0.025 | 0.059 |
0.000 0.000 | 0.000 |
0.000 0.000 | 0.000 |
0.000 0.000 | 0.000 |
0.000 0.000 | 0.000 |
|||
| Plot | Lyso | Other | |||||||||||
| Expt C |
6 peptides |
80 spectra |
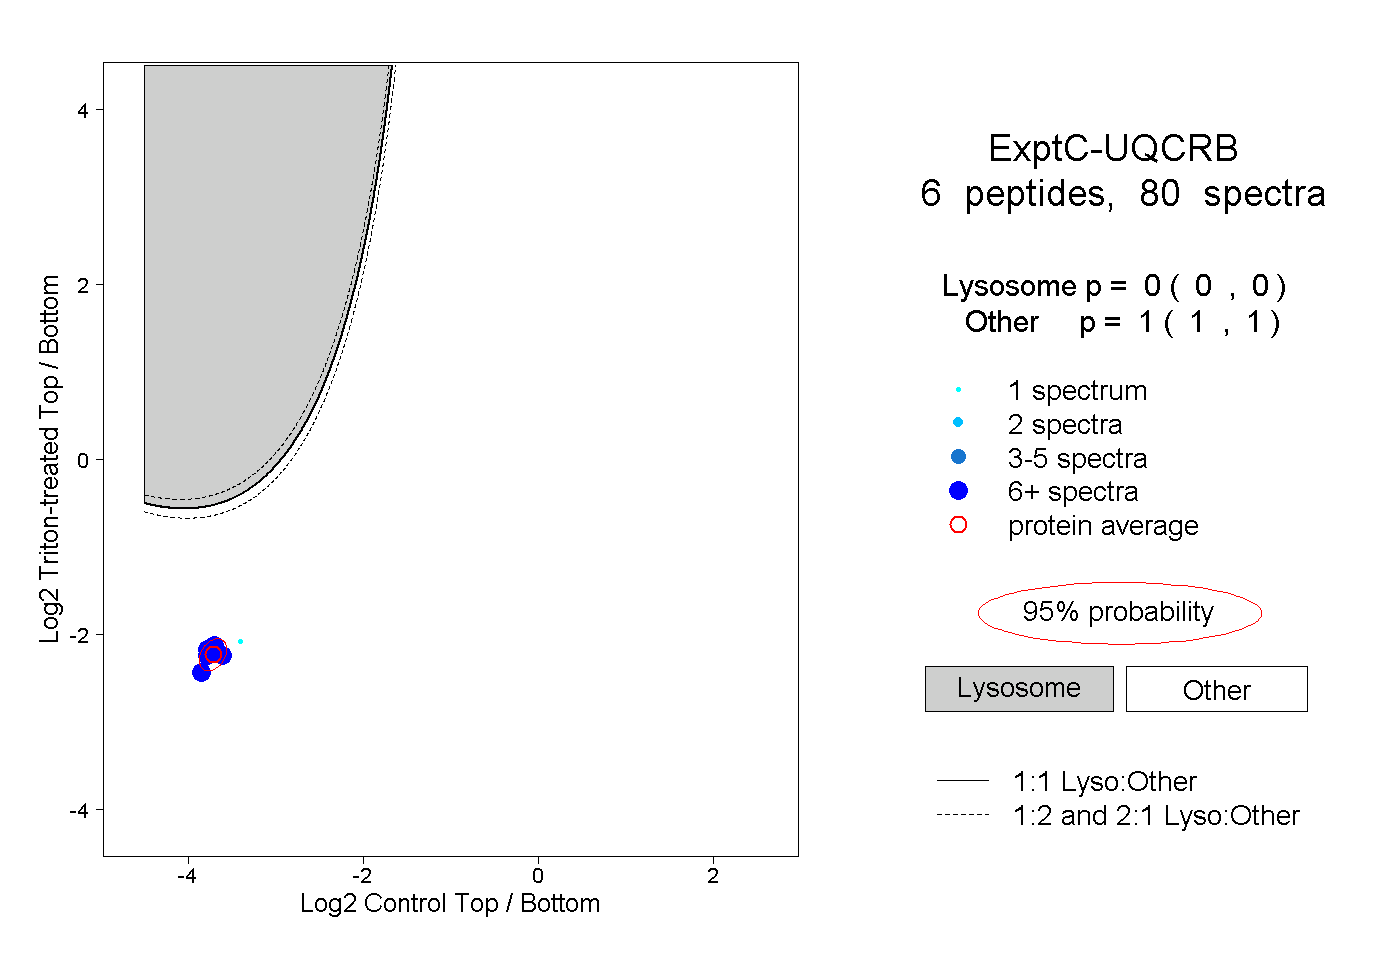 |
0.000 0.000 | 0.000 |
1.000 1.000 | 1.000 |
||||||||
| Plot | Lyso | Other | |||||||||||
| Expt D |
2 peptides |
3 spectra |
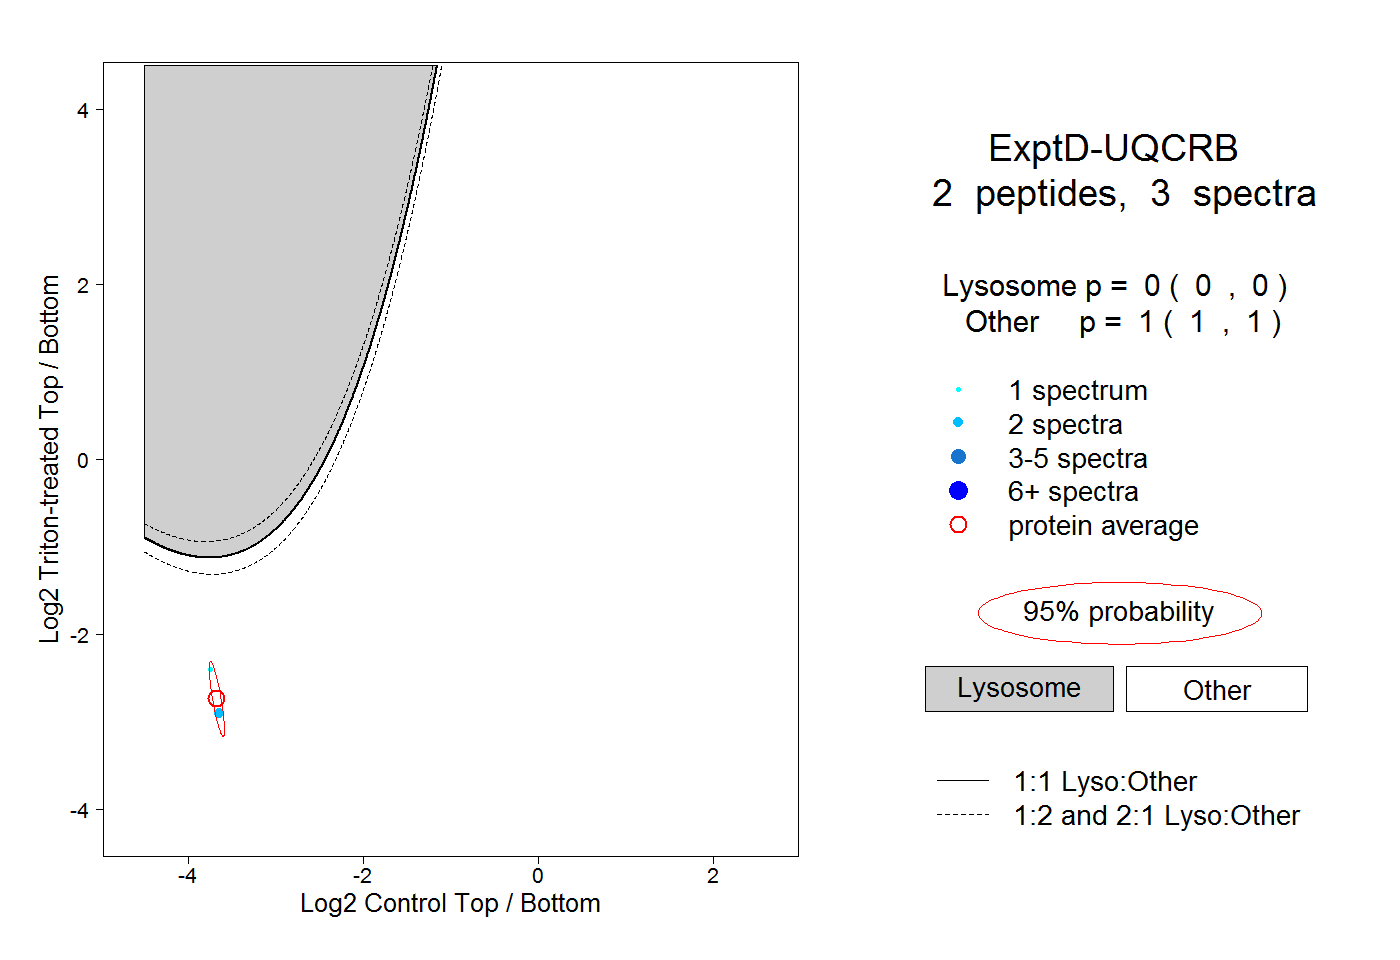 |
0.000 0.000 | 0.000 |
1.000 1.000 | 1.000 |