7
7peptides
spectra
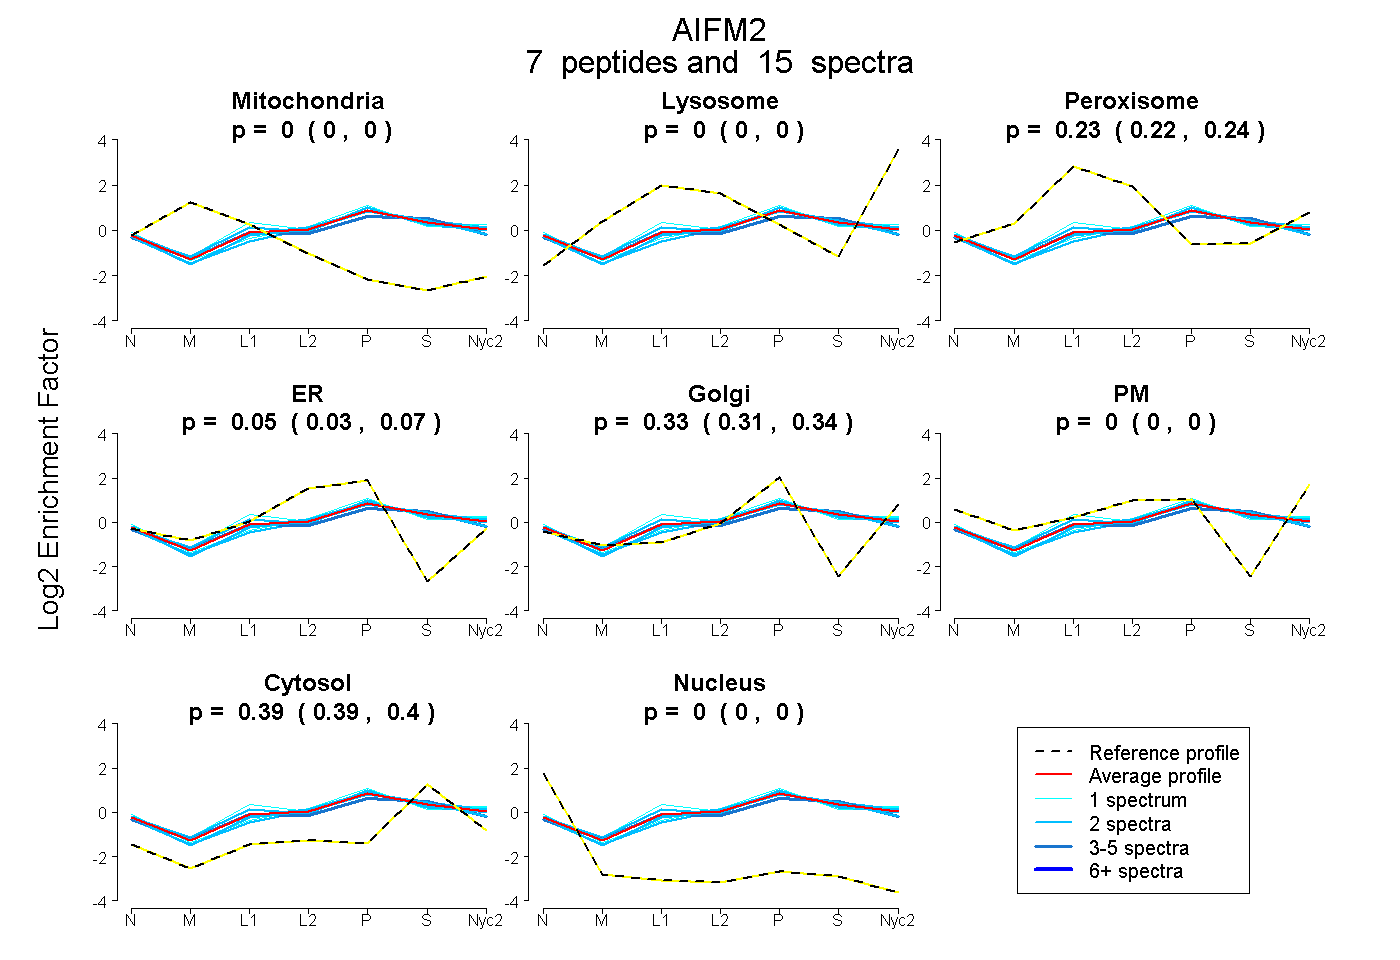
0.000 | 0.000
0.000 | 0.000
0.217 | 0.236
0.033 | 0.068
0.307 | 0.341
0.000 | 0.000
0.388 | 0.400
0.000 | 0.000
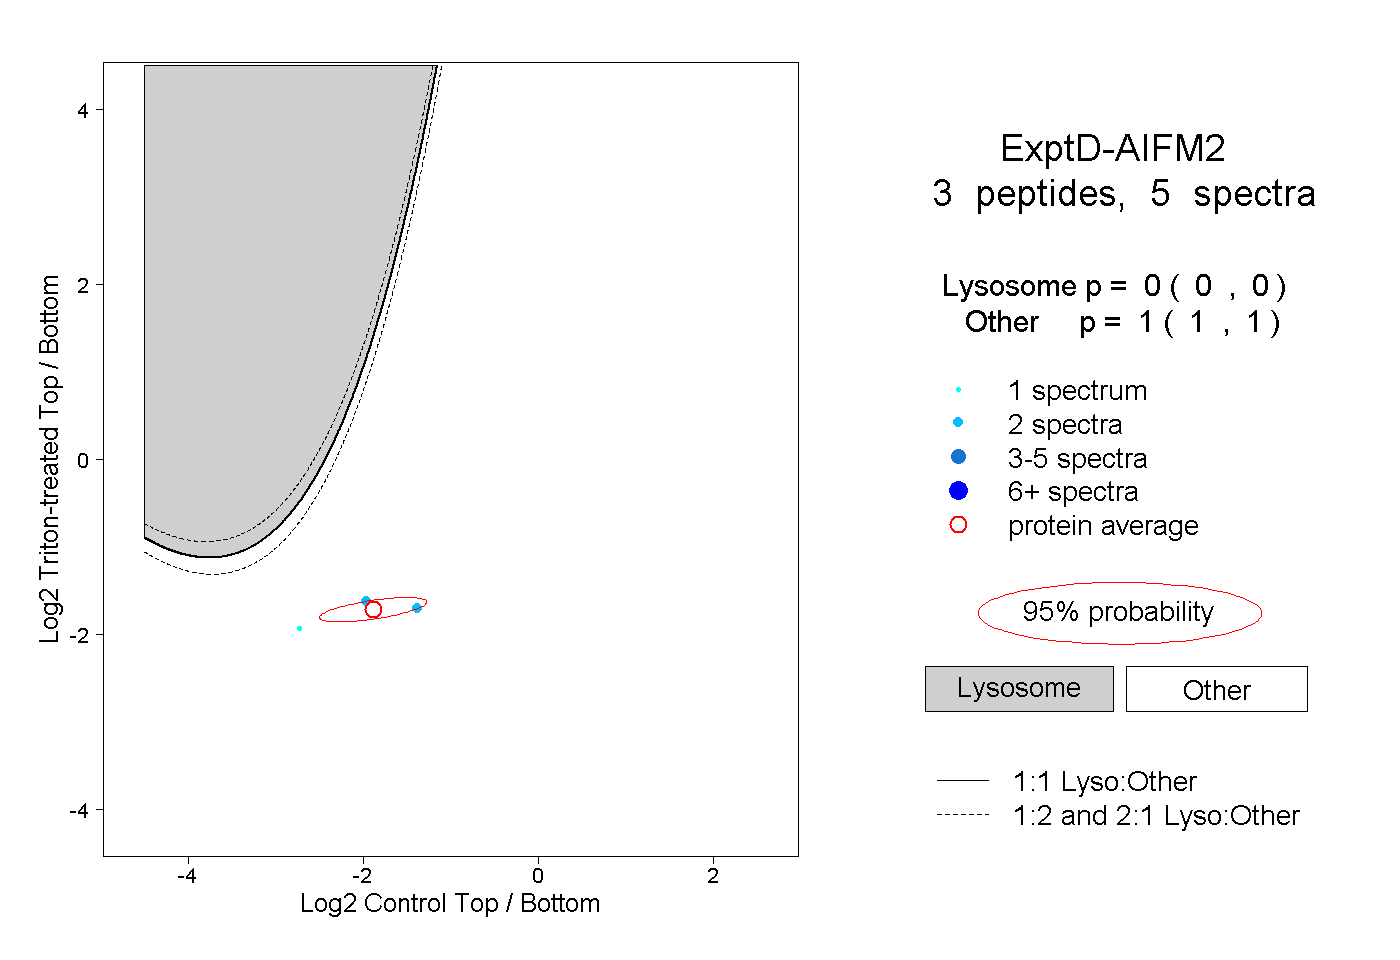
3peptides
spectra
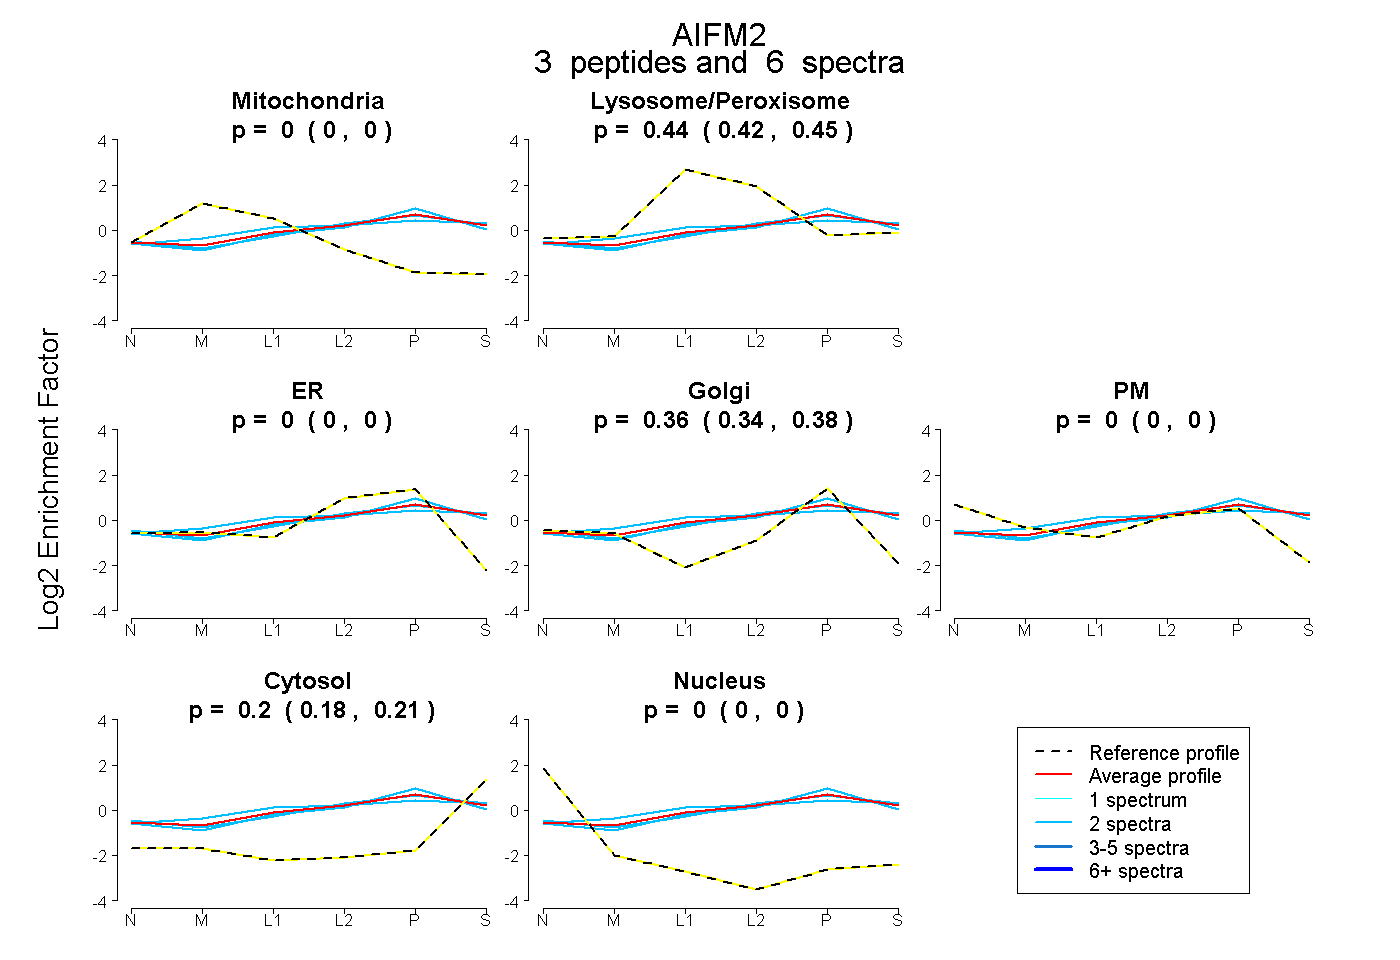
0.000 | 0.000
0.424 | 0.452
0.000 | 0.000
0.340 | 0.381
0.000 | 0.000
0.179 | 0.215
0.000 | 0.000
14peptides
spectra
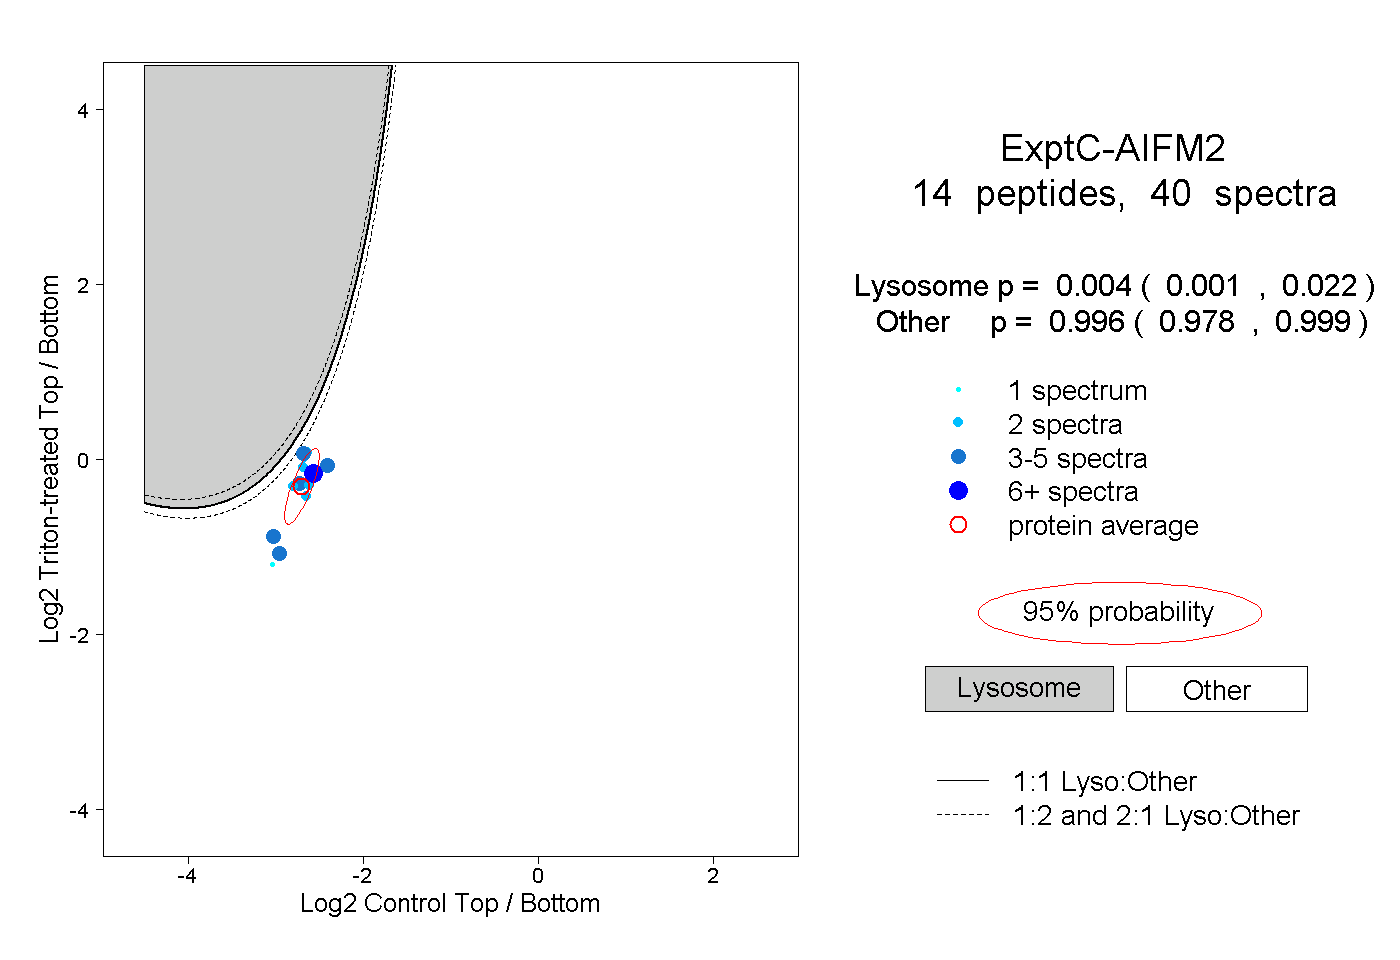
0.001 | 0.022
0.978 | 0.999