 7
7peptides
spectra
0.000 | 0.000
0.000 | 0.000
0.217 | 0.236
0.033 | 0.068
0.307 | 0.341
0.000 | 0.000
0.388 | 0.400
0.000 | 0.000
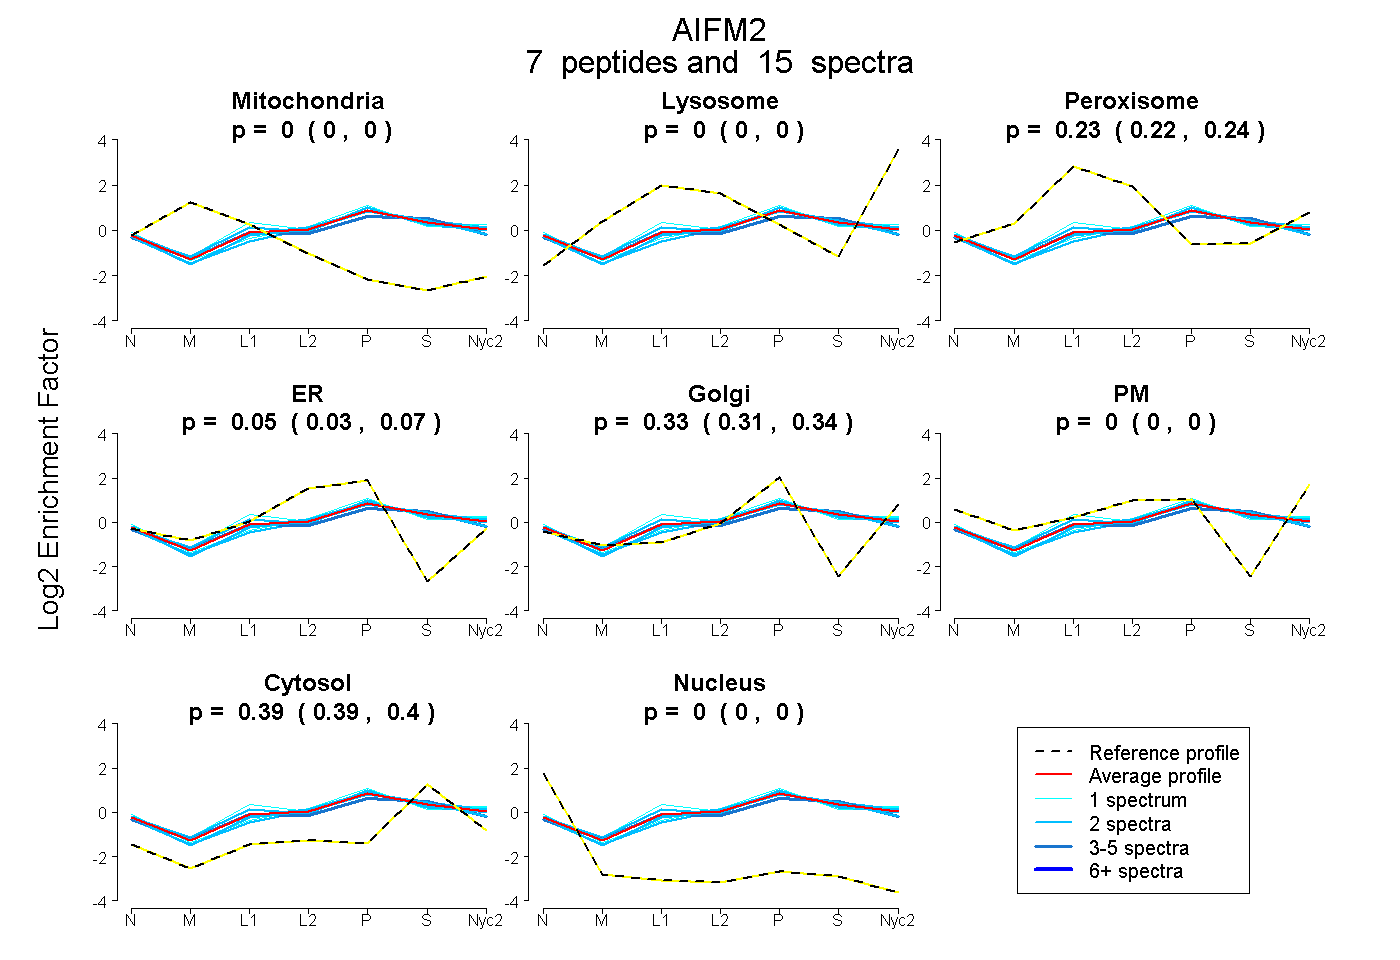
| Plot | Mito | Lyso | Perox | ER | Golgi | PM | Cytosol | Nucleus | |||||
| Expt A |
7 peptides |
15 spectra |
|
0.000 0.000 | 0.000 |
0.000 0.000 | 0.000 |
0.227 0.217 | 0.236 |
0.053 0.033 | 0.068 |
0.326 0.307 | 0.341 |
0.000 0.000 | 0.000 |
0.395 0.388 | 0.400 |
0.000 0.000 | 0.000 |
| 2 spectra, VSNLEELPR | 0.000 | 0.000 | 0.222 | 0.106 | 0.288 | 0.000 | 0.385 | 0.000 | ||
| 2 spectra, GVQLLLSER | 0.000 | 0.000 | 0.270 | 0.000 | 0.384 | 0.000 | 0.346 | 0.000 | ||
| 1 spectrum, AYKPGALTFLLSMGR | 0.000 | 0.000 | 0.315 | 0.000 | 0.355 | 0.000 | 0.330 | 0.000 | ||
| 2 spectra, EVTLIHSR | 0.000 | 0.000 | 0.173 | 0.044 | 0.350 | 0.005 | 0.429 | 0.000 | ||
| 5 spectra, SAFESR | 0.000 | 0.000 | 0.234 | 0.057 | 0.254 | 0.000 | 0.455 | 0.000 | ||
| 2 spectra, VIGIDLK | 0.000 | 0.000 | 0.167 | 0.176 | 0.200 | 0.000 | 0.457 | 0.000 | ||
| 1 spectrum, TEYPEK | 0.000 | 0.000 | 0.152 | 0.069 | 0.329 | 0.084 | 0.366 | 0.000 |
| Plot | Mito | Lyso or Perox | ER | Golgi | PM | Cytosol | Nucleus | ||||||
| Expt B |
3 peptides |
6 spectra |
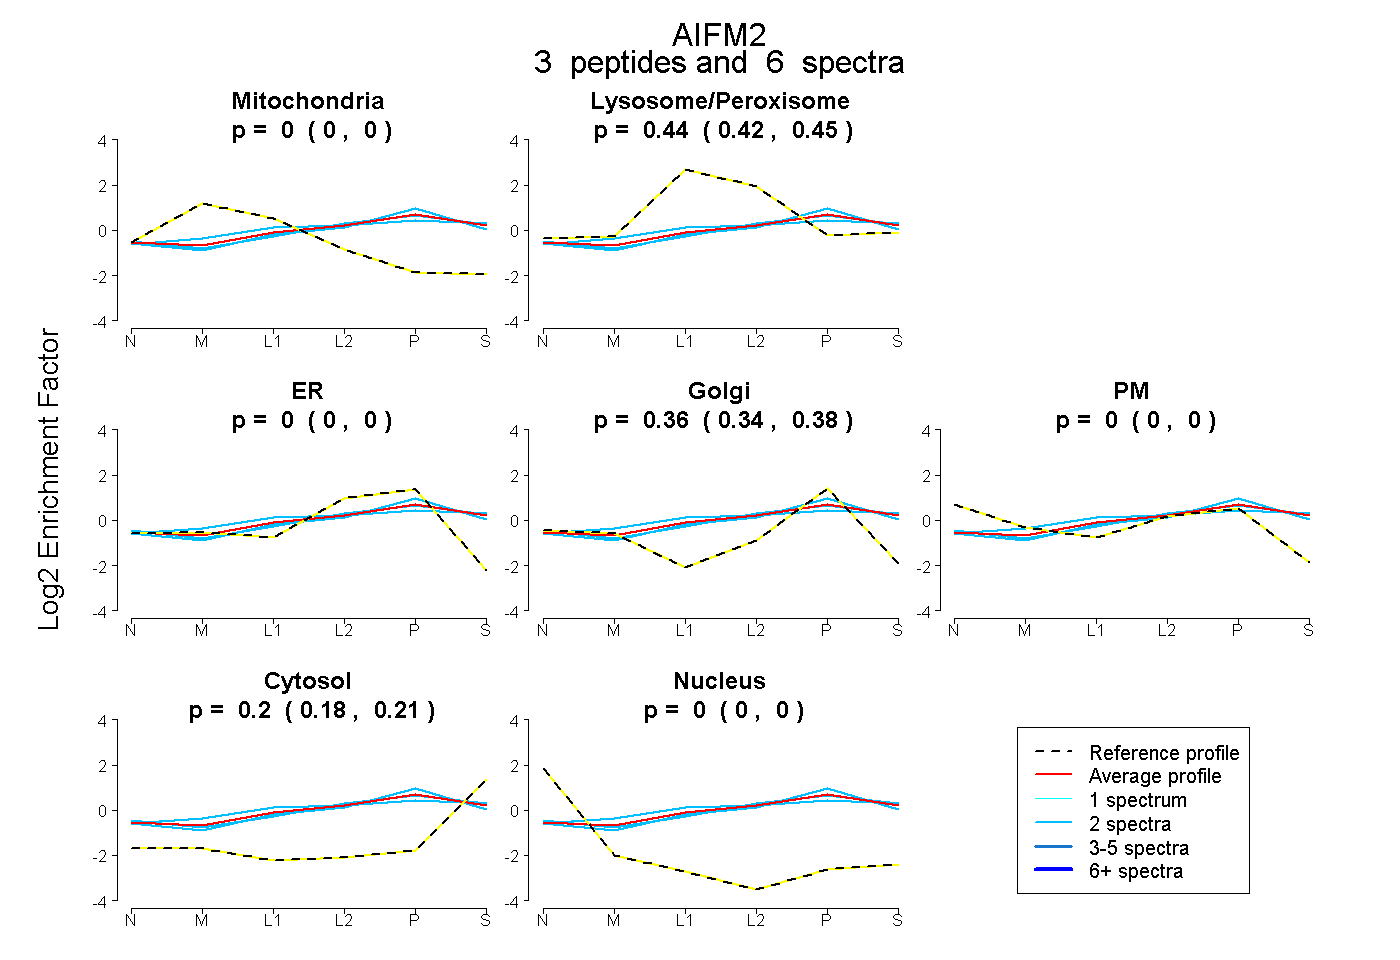 |
0.000 0.000 | 0.000 |
0.439 0.424 | 0.452 |
0.000 0.000 | 0.000 |
0.362 0.340 | 0.381 |
0.000 0.000 | 0.000 |
0.199 0.179 | 0.215 |
0.000 0.000 | 0.000 |
|||
| Plot | Lyso | Other | |||||||||||
| Expt C |
14 peptides |
40 spectra |
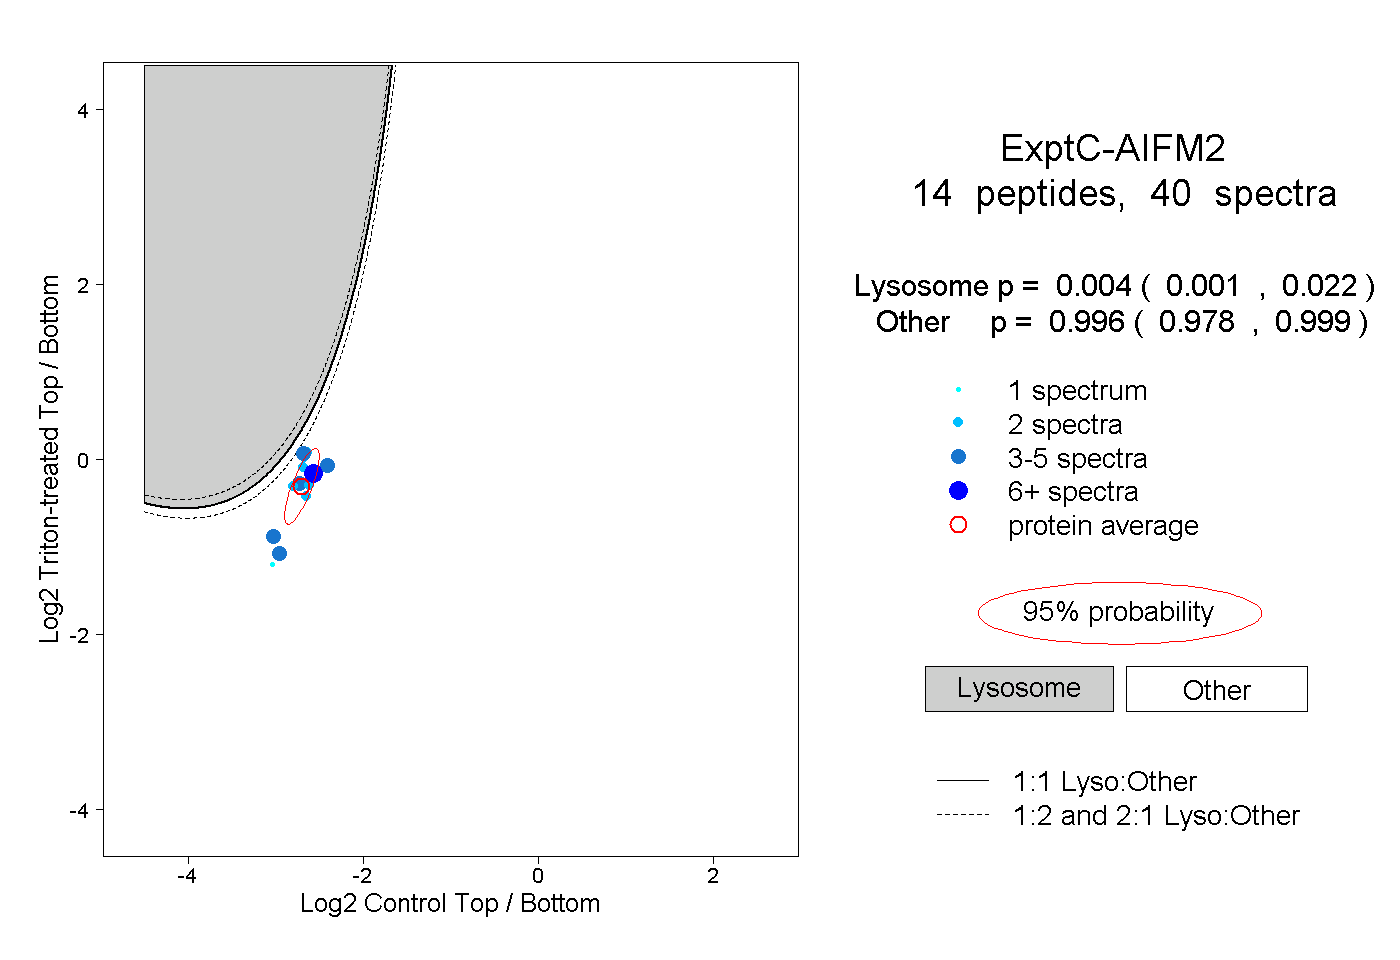 |
0.004 0.001 | 0.022 |
0.996 0.978 | 0.999 |
||||||||
| Plot | Lyso | Other | |||||||||||
| Expt D |
3 peptides |
5 spectra |
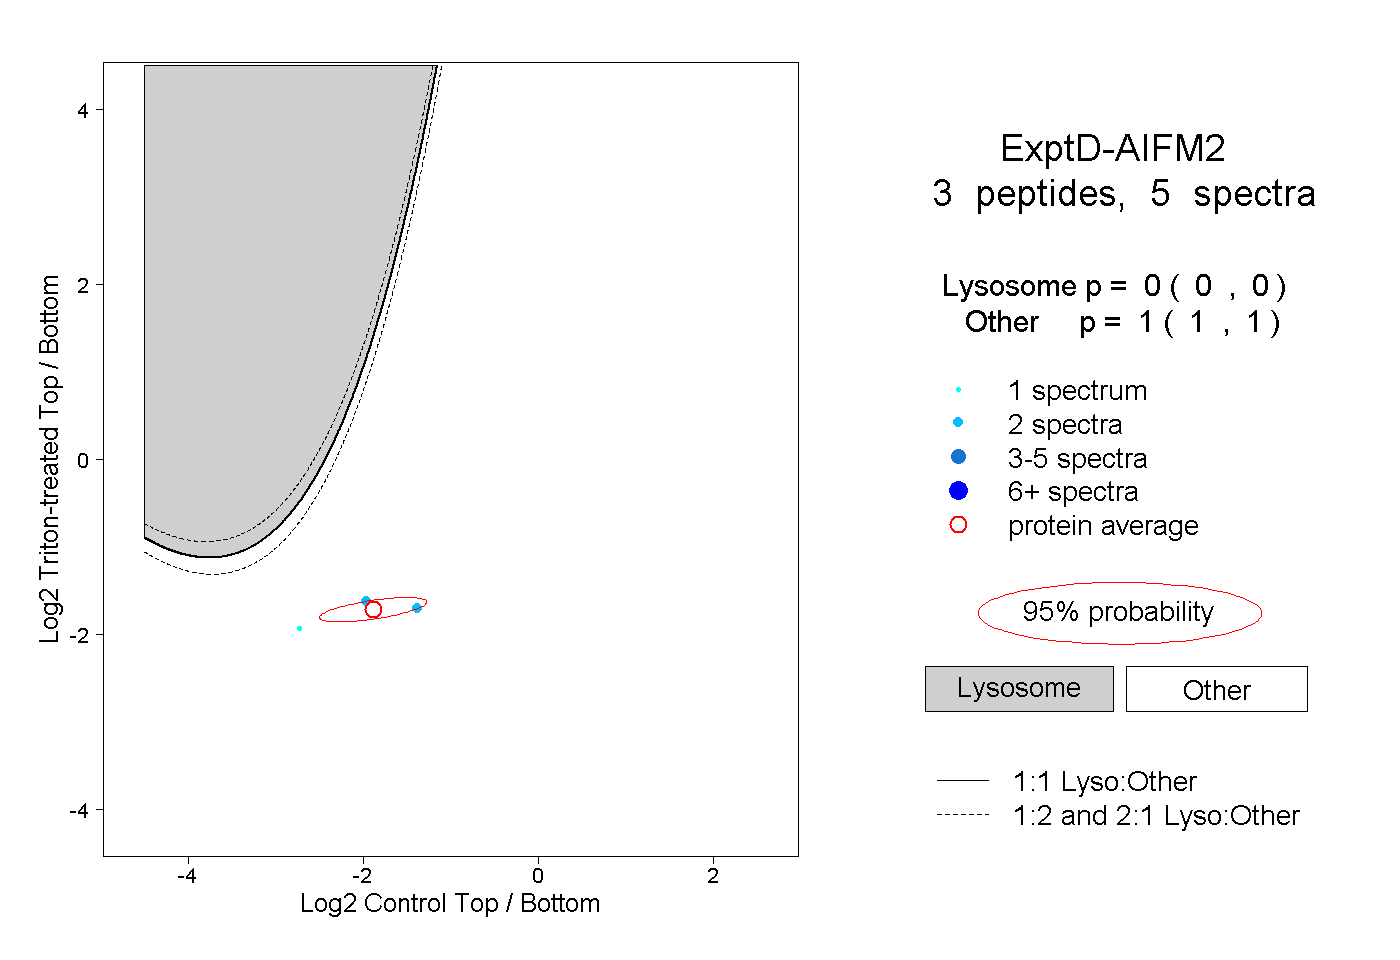 |
0.000 0.000 | 0.000 |
1.000 1.000 | 1.000 |