 11
11peptides
spectra
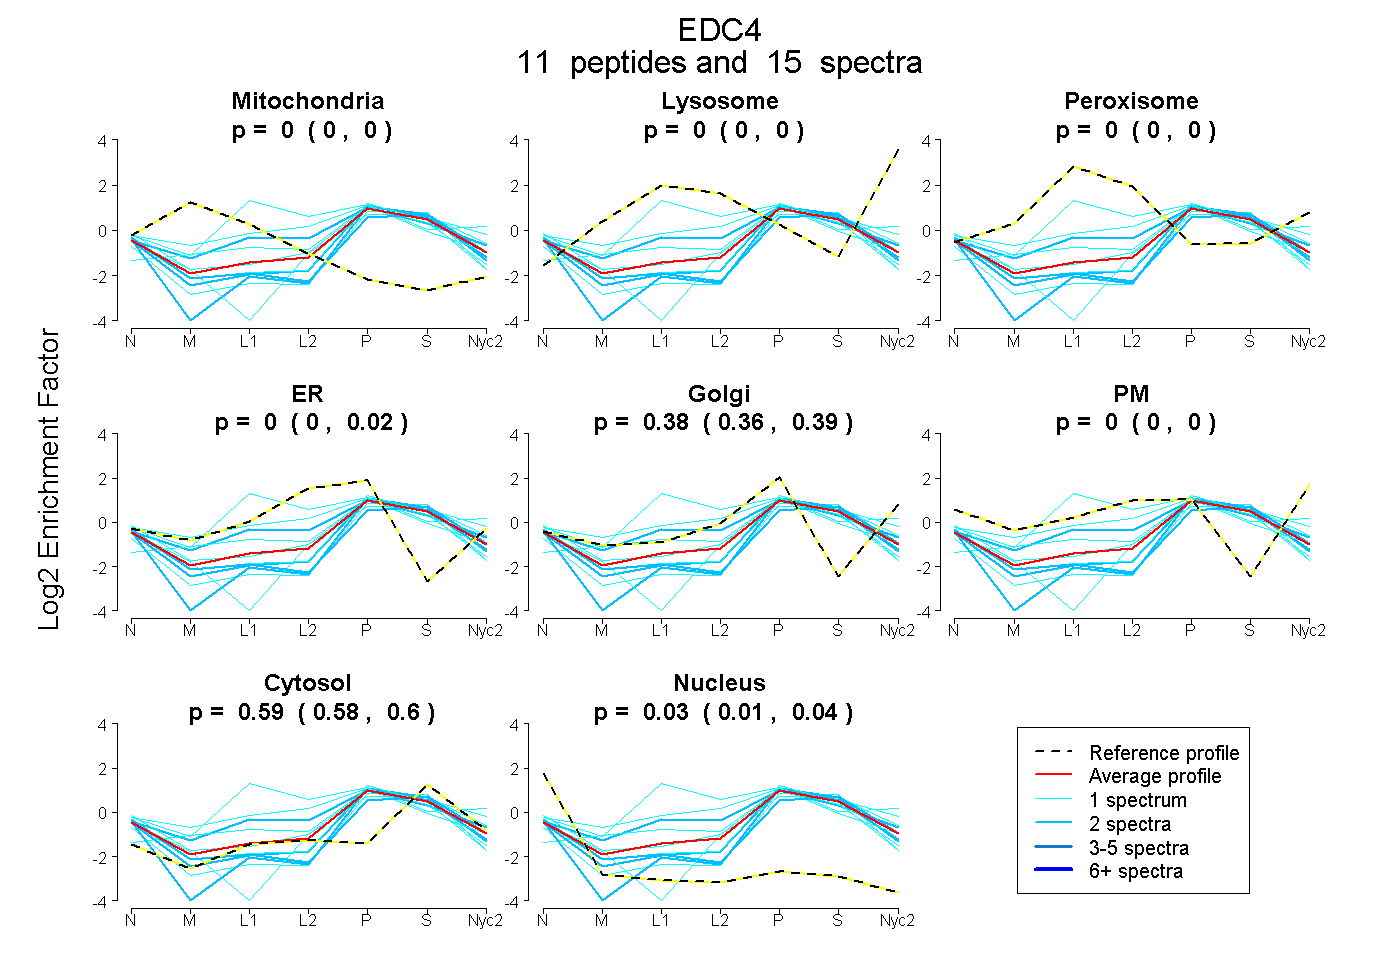
0.000 | 0.000
0.000 | 0.000
0.000 | 0.000
0.000 | 0.020
0.357 | 0.391
0.000 | 0.000
0.582 | 0.602
0.011 | 0.037
| Plot | Mito | Lyso | Perox | ER | Golgi | PM | Cytosol | Nucleus | |||||
| Expt A |
11 peptides |
15 spectra |
|
0.000 0.000 | 0.000 |
0.000 0.000 | 0.000 |
0.000 0.000 | 0.000 |
0.000 0.000 | 0.020 |
0.382 0.357 | 0.391 |
0.000 0.000 | 0.000 |
0.593 0.582 | 0.602 |
0.025 0.011 | 0.037 |
| 1 spectrum, QGFIVVK | 0.000 | 0.000 | 0.444 | 0.134 | 0.207 | 0.000 | 0.215 | 0.000 | ||
| 1 spectrum, LTAVEGSMK | 0.000 | 0.000 | 0.000 | 0.000 | 0.317 | 0.000 | 0.558 | 0.125 | ||
| 1 spectrum, AEVWDLDMLR | 0.000 | 0.000 | 0.000 | 0.000 | 0.163 | 0.000 | 0.684 | 0.153 | ||
| 1 spectrum, LTEHQVVEPPEDWPALIWQQQR | 0.011 | 0.000 | 0.105 | 0.495 | 0.000 | 0.000 | 0.390 | 0.000 | ||
| 2 spectra, ETCSTLTESPR | 0.000 | 0.000 | 0.000 | 0.000 | 0.183 | 0.000 | 0.671 | 0.146 | ||
| 2 spectra, ALQDVQIR | 0.000 | 0.000 | 0.085 | 0.272 | 0.156 | 0.000 | 0.487 | 0.000 | ||
| 2 spectra, EPVLAQLR | 0.000 | 0.000 | 0.000 | 0.000 | 0.309 | 0.000 | 0.601 | 0.089 | ||
| 1 spectrum, EAFQSVVLPAFEK | 0.000 | 0.056 | 0.025 | 0.000 | 0.384 | 0.000 | 0.536 | 0.000 | ||
| 1 spectrum, LFCVHTK | 0.000 | 0.000 | 0.000 | 0.000 | 0.311 | 0.000 | 0.601 | 0.088 | ||
| 1 spectrum, ELAELWHNQEELLQR | 0.000 | 0.000 | 0.000 | 0.164 | 0.217 | 0.000 | 0.530 | 0.090 | ||
| 2 spectra, VISVSTSER | 0.000 | 0.000 | 0.000 | 0.000 | 0.243 | 0.000 | 0.648 | 0.109 |
| Plot | Mito | Lyso or Perox | ER | Golgi | PM | Cytosol | Nucleus | ||||||
| Expt B |
2 peptides |
2 spectra |
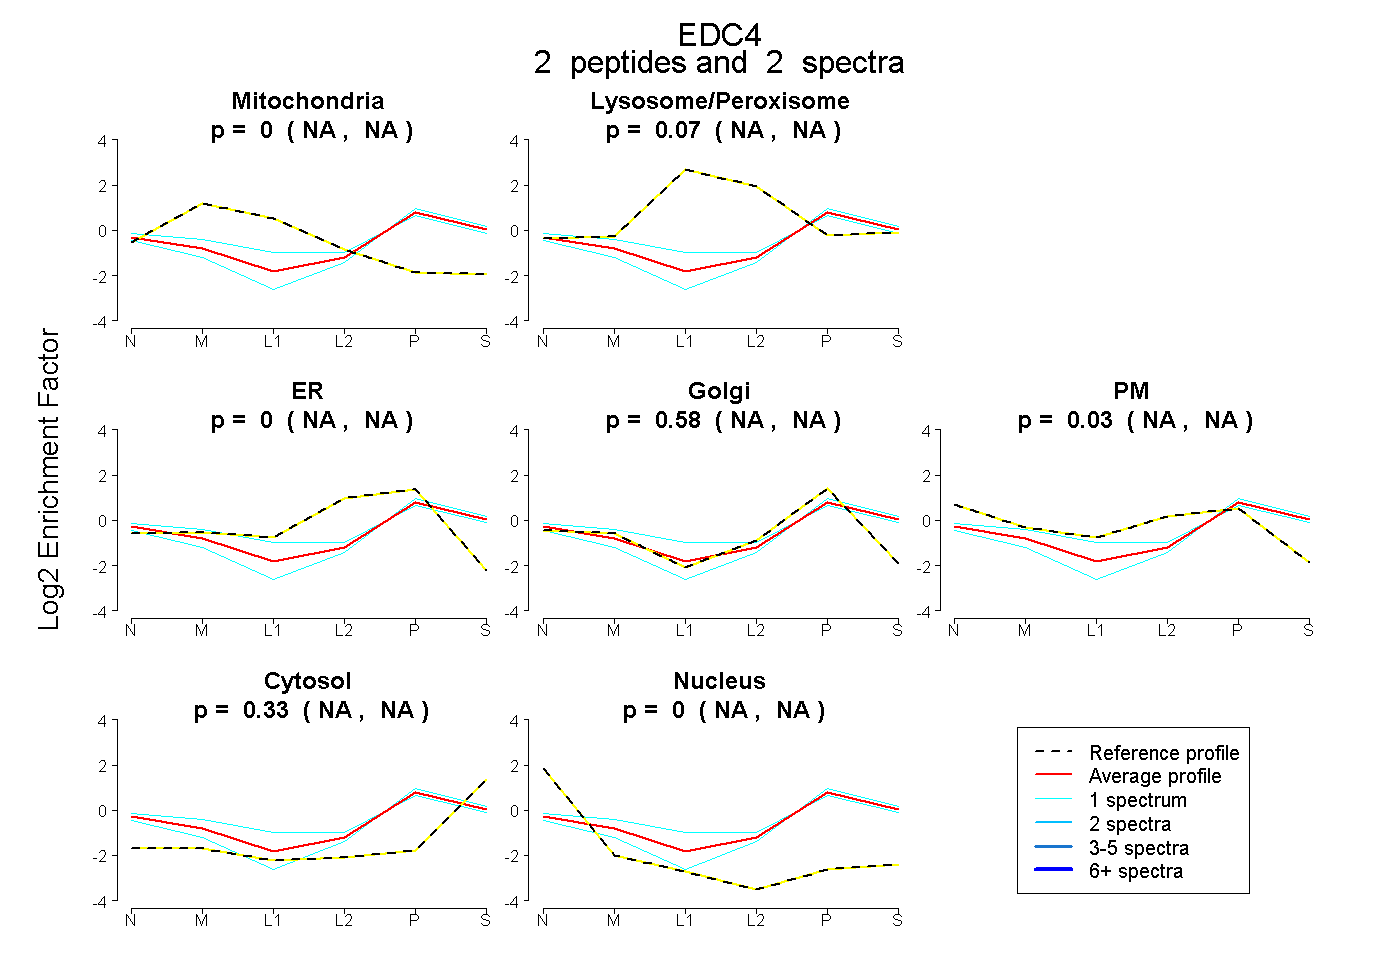 |
0.000 NA | NA |
0.066 NA | NA |
0.000 NA | NA |
0.577 NA | NA |
0.030 NA | NA |
0.326 NA | NA |
0.000 NA | NA |
|||
| Plot | Lyso | Other | |||||||||||
| Expt C |
1 peptide |
2 spectra |
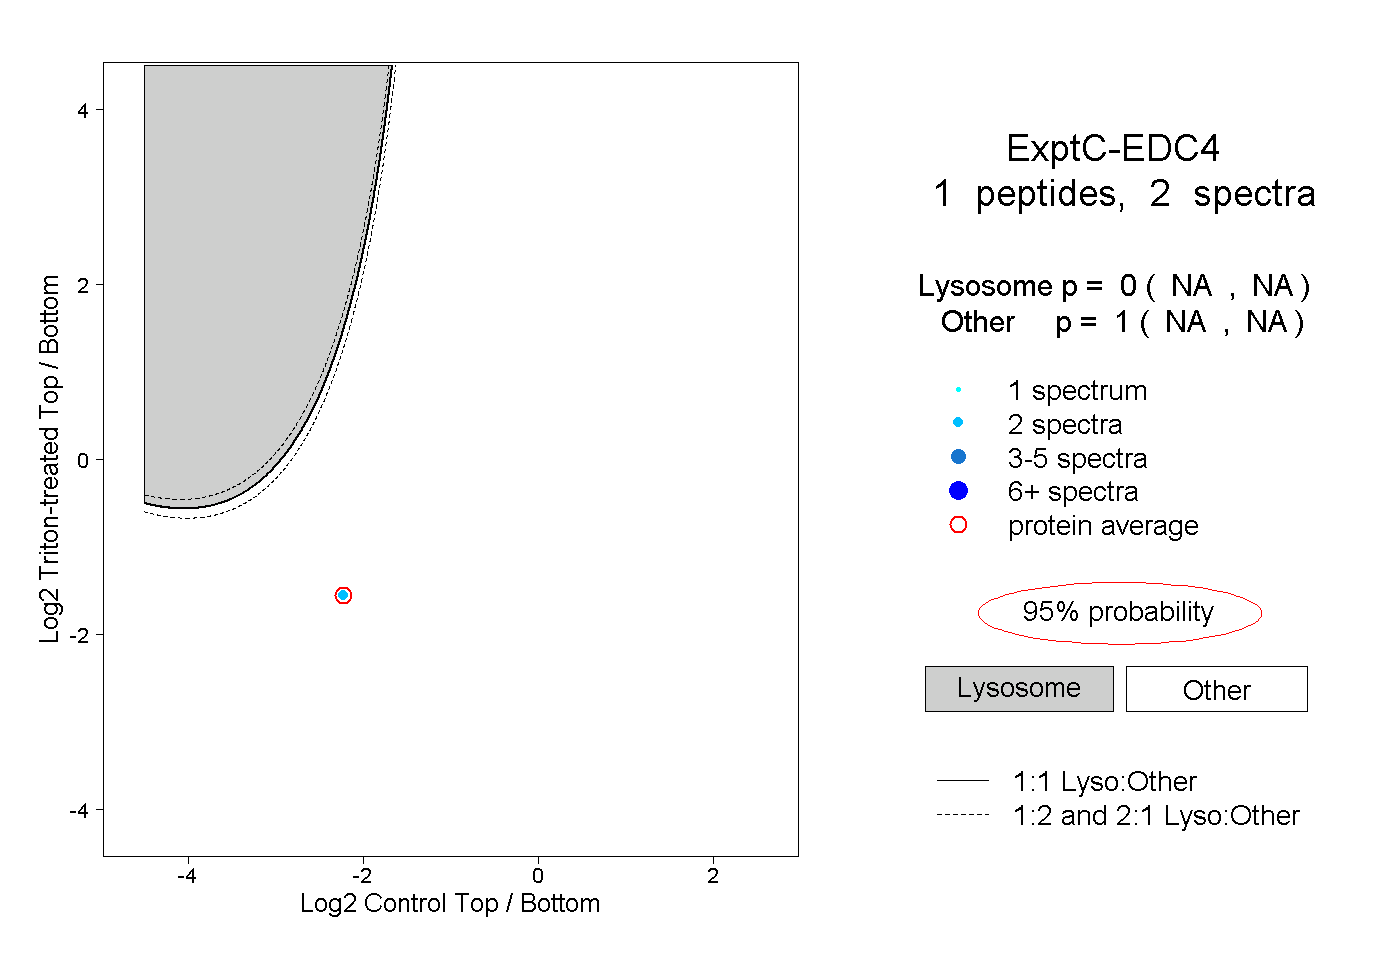 |
0.000 NA | NA |
1.000 NA | NA |