 5
5peptides
spectra
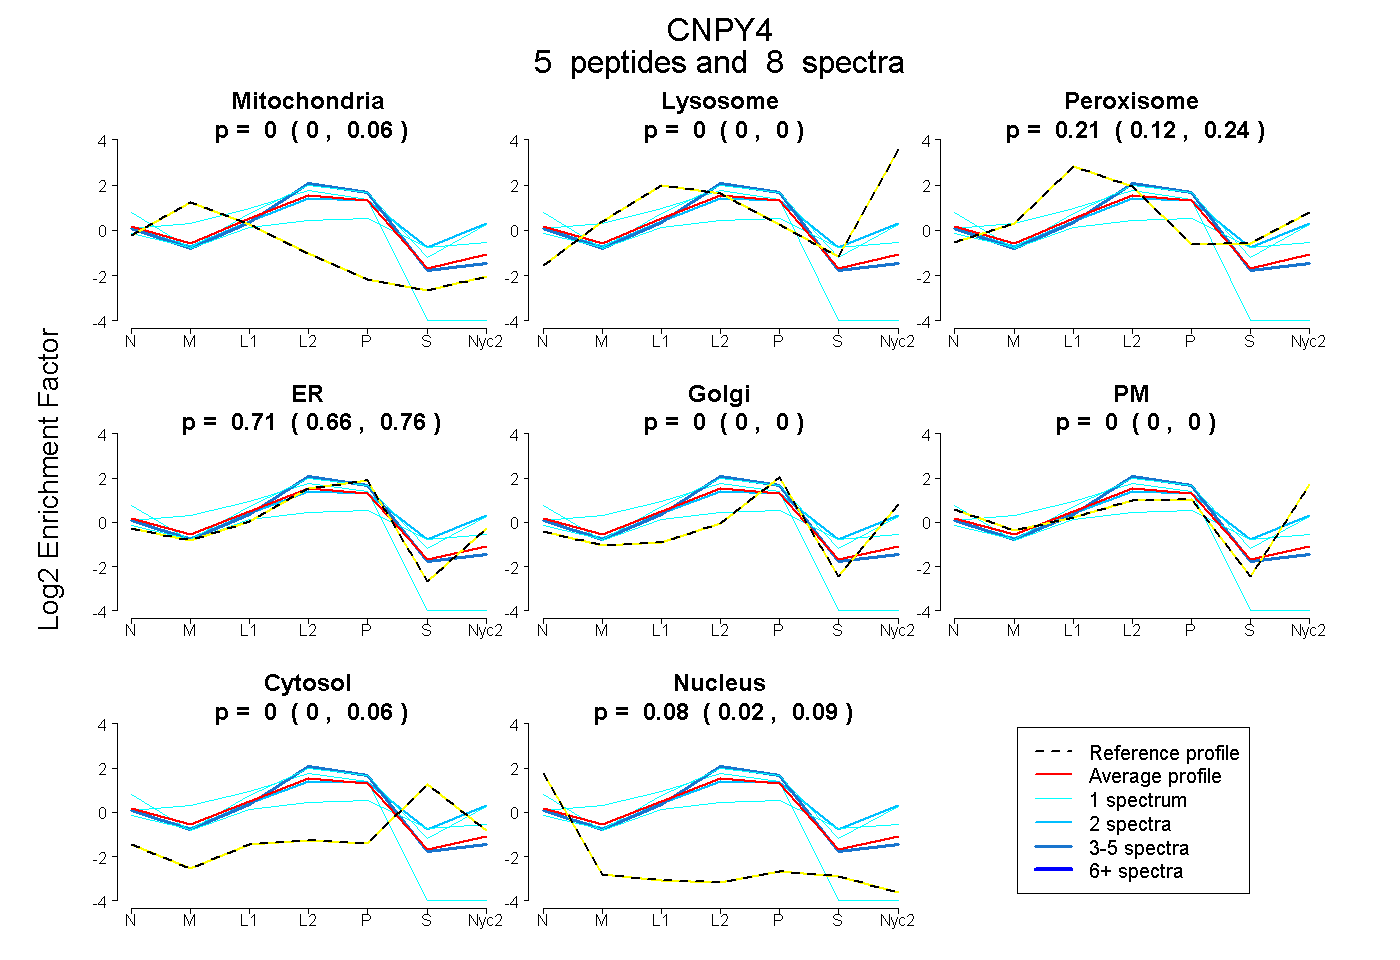
0.000 | 0.058
0.000 | 0.000
0.118 | 0.239
0.661 | 0.763
0.000 | 0.000
0.000 | 0.000
0.000 | 0.062
0.024 | 0.089
| Plot | Mito | Lyso | Perox | ER | Golgi | PM | Cytosol | Nucleus | |||||
| Expt A |
5 peptides |
8 spectra |
|
0.000 0.000 | 0.058 |
0.000 0.000 | 0.000 |
0.213 0.118 | 0.239 |
0.711 0.661 | 0.763 |
0.000 0.000 | 0.000 |
0.000 0.000 | 0.000 |
0.000 0.000 | 0.062 |
0.075 0.024 | 0.089 |
| 1 spectrum, LLSMELQEELSR | 0.000 | 0.044 | 0.251 | 0.675 | 0.000 | 0.000 | 0.030 | 0.000 | ||
| 2 spectra, ILDYNVHAER | 0.000 | 0.000 | 0.225 | 0.451 | 0.000 | 0.180 | 0.144 | 0.000 | ||
| 1 spectrum, HVLPATETACLQETWTGK | 0.348 | 0.000 | 0.000 | 0.652 | 0.000 | 0.000 | 0.000 | 0.000 | ||
| 1 spectrum, TSGTPK | 0.000 | 0.000 | 0.243 | 0.306 | 0.000 | 0.153 | 0.167 | 0.131 | ||
| 3 spectra, LEEALENLCER | 0.000 | 0.000 | 0.106 | 0.851 | 0.000 | 0.000 | 0.007 | 0.036 |
| Plot | Lyso | Other | |||||||||||
| Expt C |
4 peptides |
11 spectra |
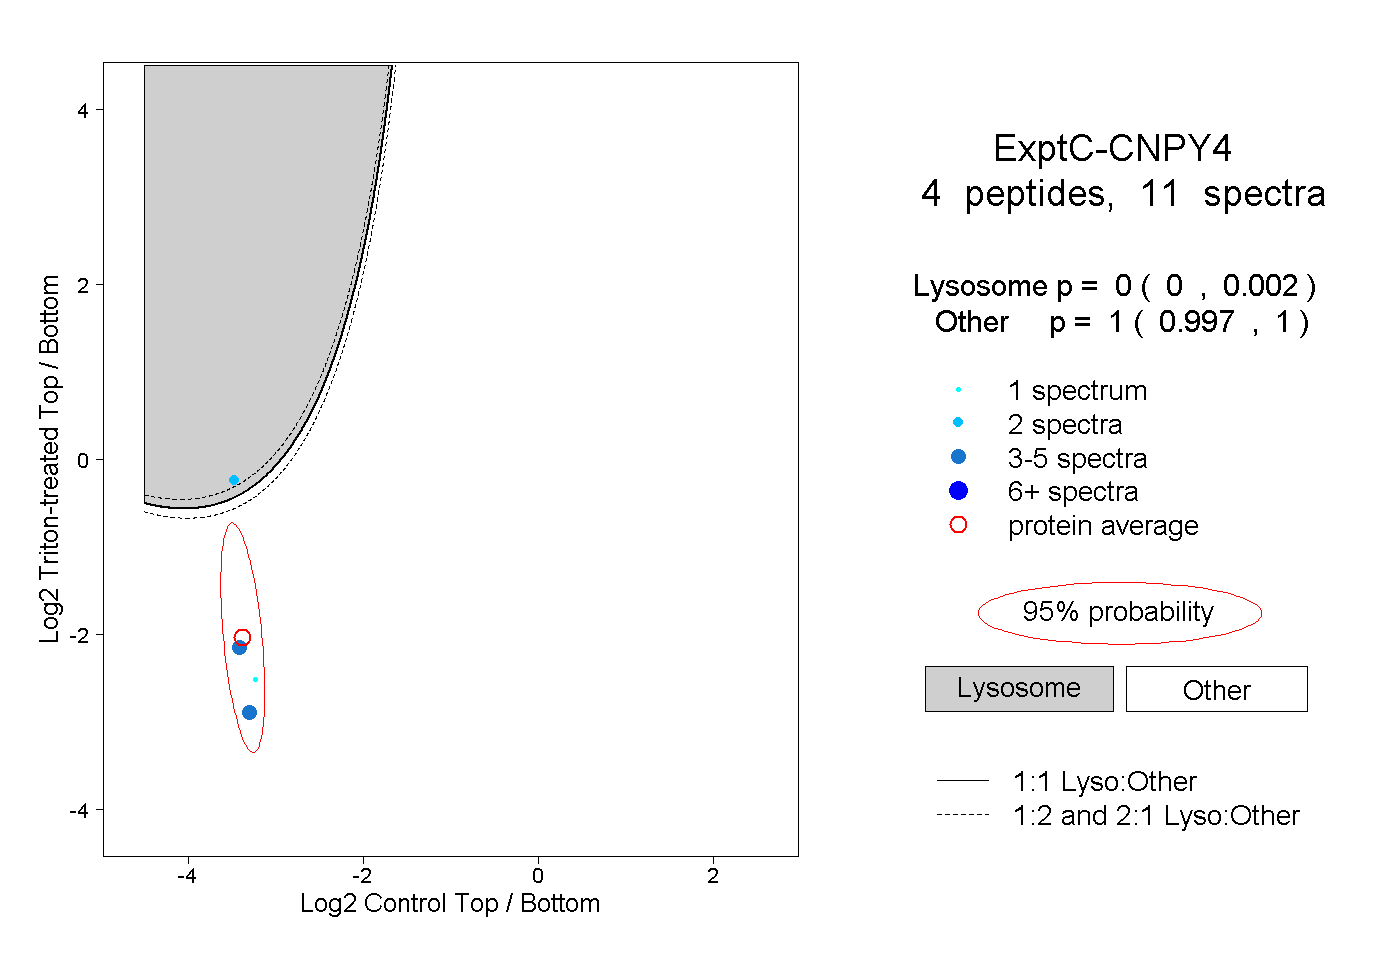 |
0.000 0.000 | 0.002 |
1.000 0.997 | 1.000 |