 4
4peptides
spectra
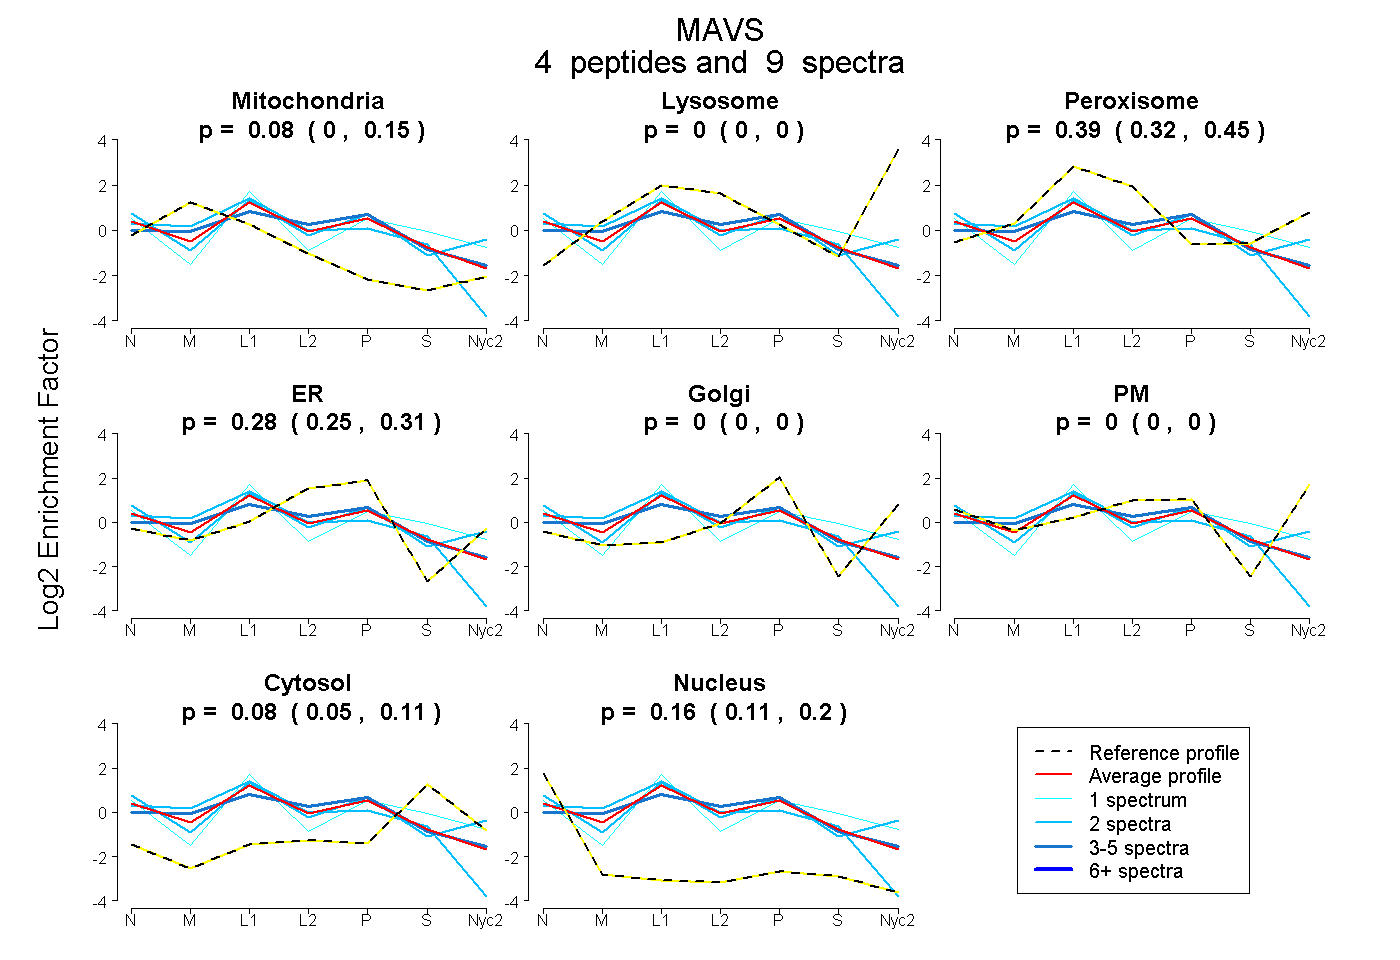
0.001 | 0.148
0.000 | 0.000
0.323 | 0.448
0.248 | 0.312
0.000 | 0.000
0.000 | 0.000
0.050 | 0.110
0.115 | 0.203
2peptides
spectra
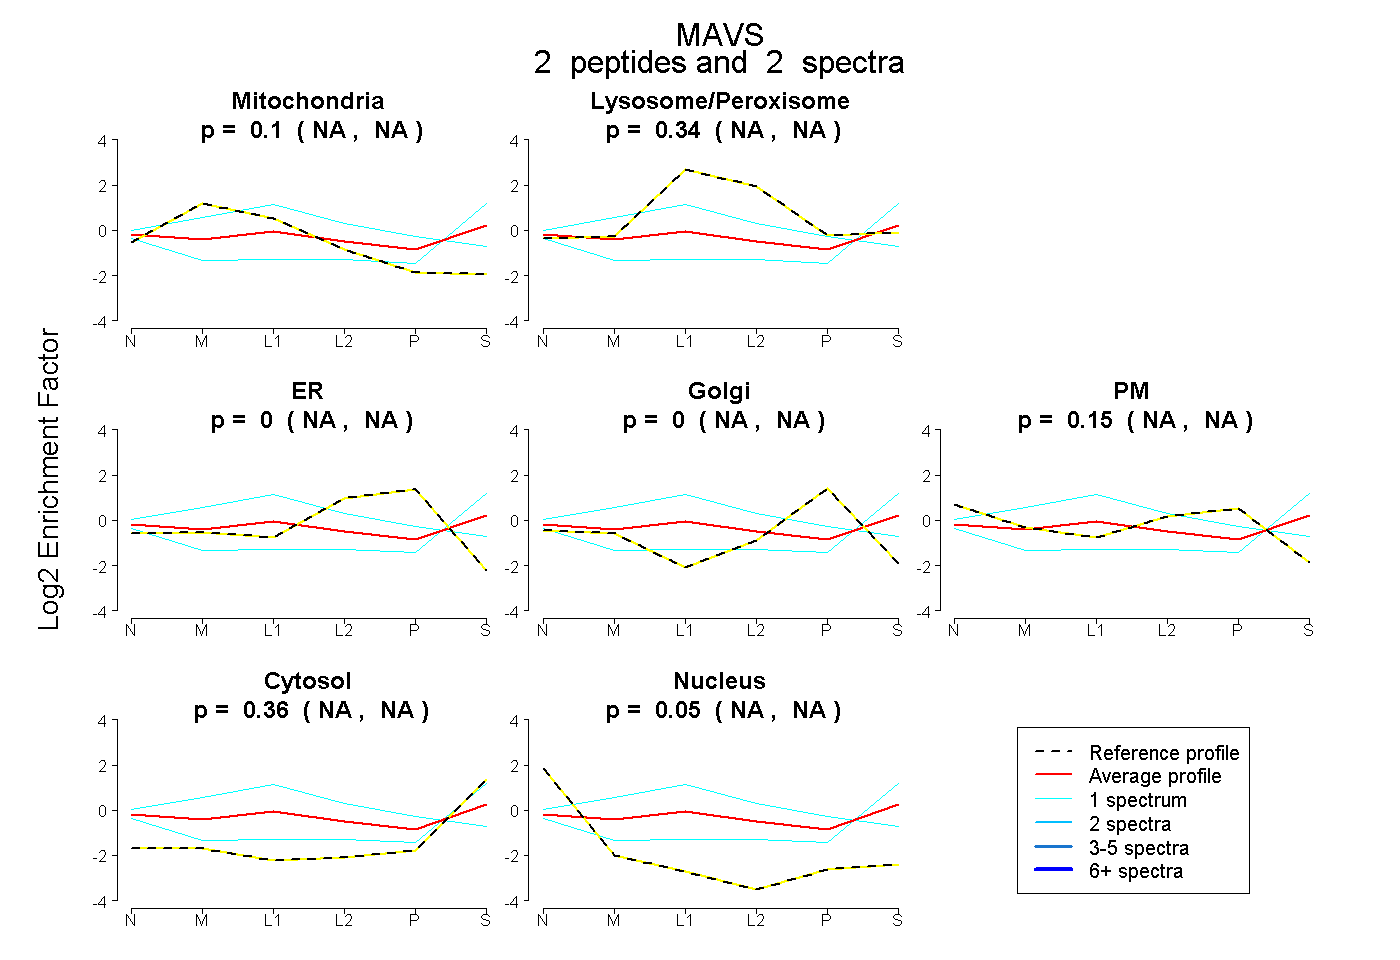
NA | NA
NA | NA
NA | NA
NA | NA
NA | NA
NA | NA
NA | NA
6peptides
spectra
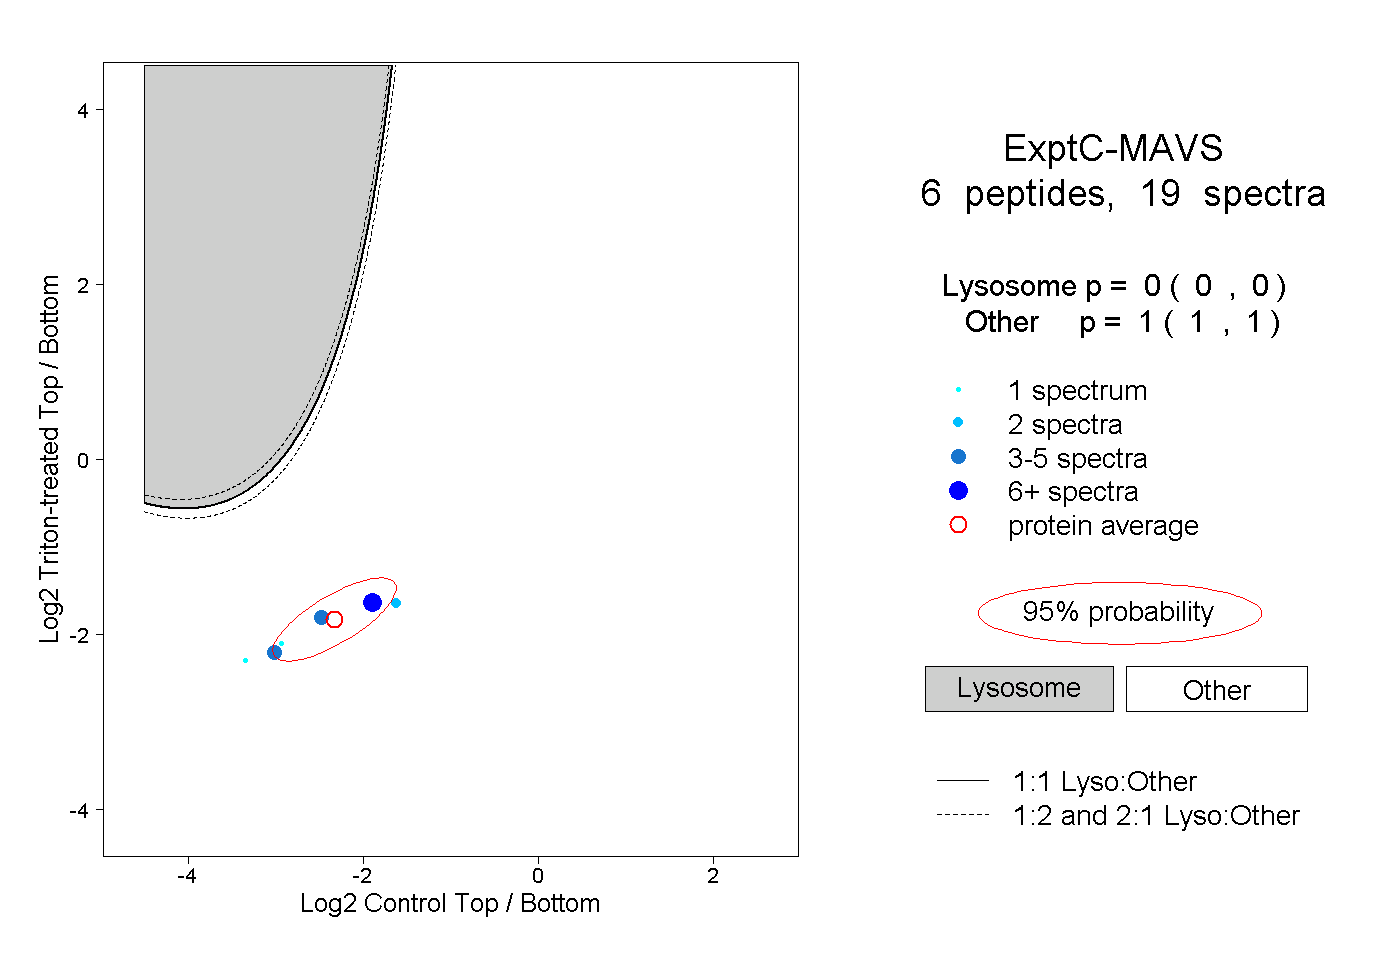
0.000 | 0.000
1.000 | 1.000
2peptides
spectra
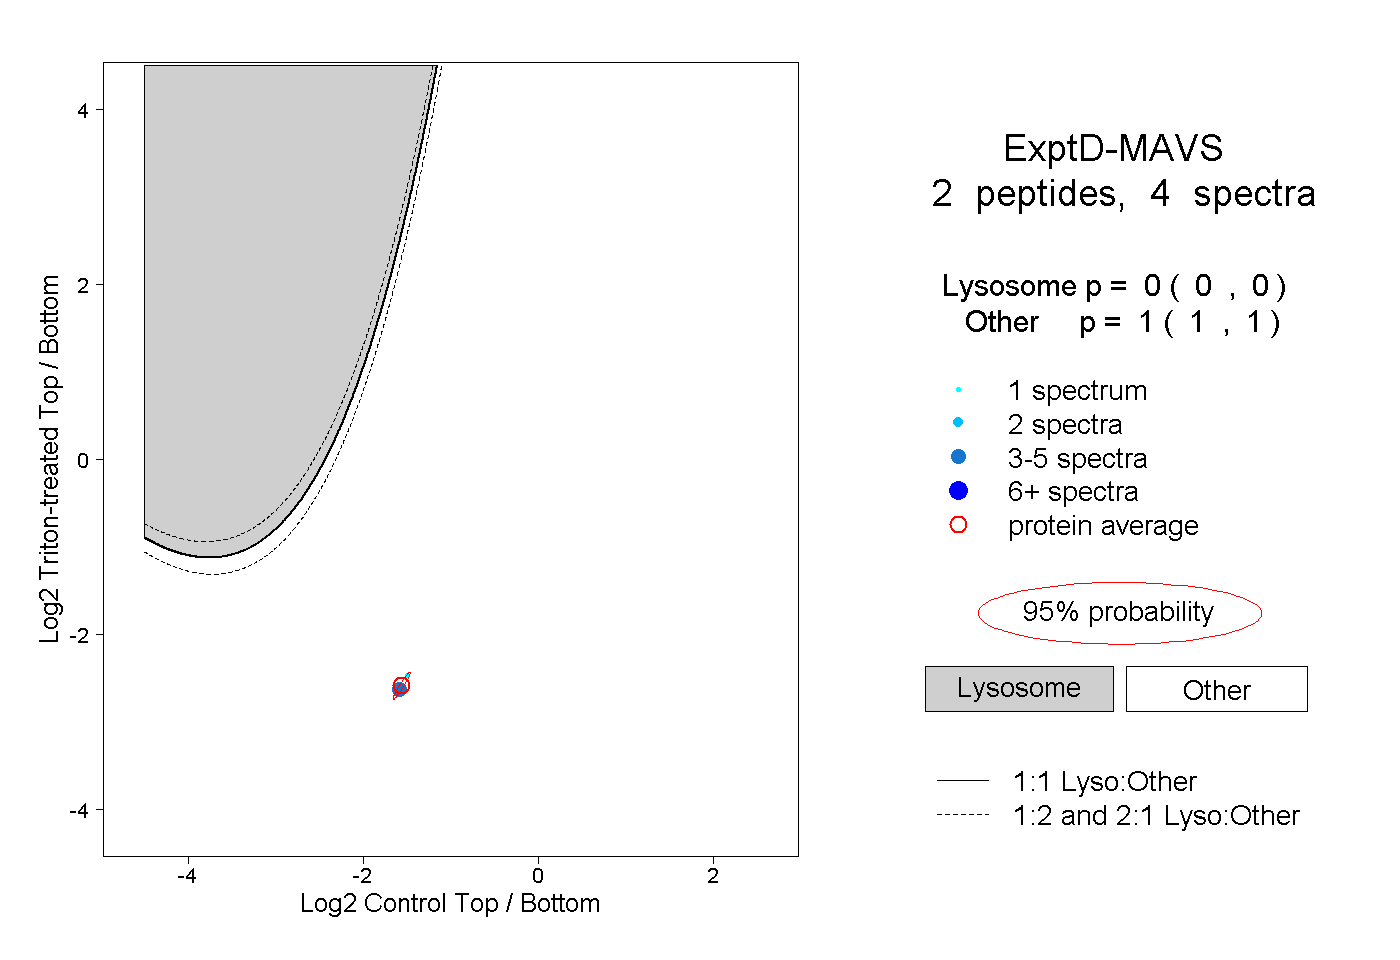
0.000 | 0.000
1.000 | 1.000