 4
4peptides
spectra
0.001 | 0.148
0.000 | 0.000
0.323 | 0.448
0.248 | 0.312
0.000 | 0.000
0.000 | 0.000
0.050 | 0.110
0.115 | 0.203
| Plot | Mito | Lyso | Perox | ER | Golgi | PM | Cytosol | Nucleus | |||||
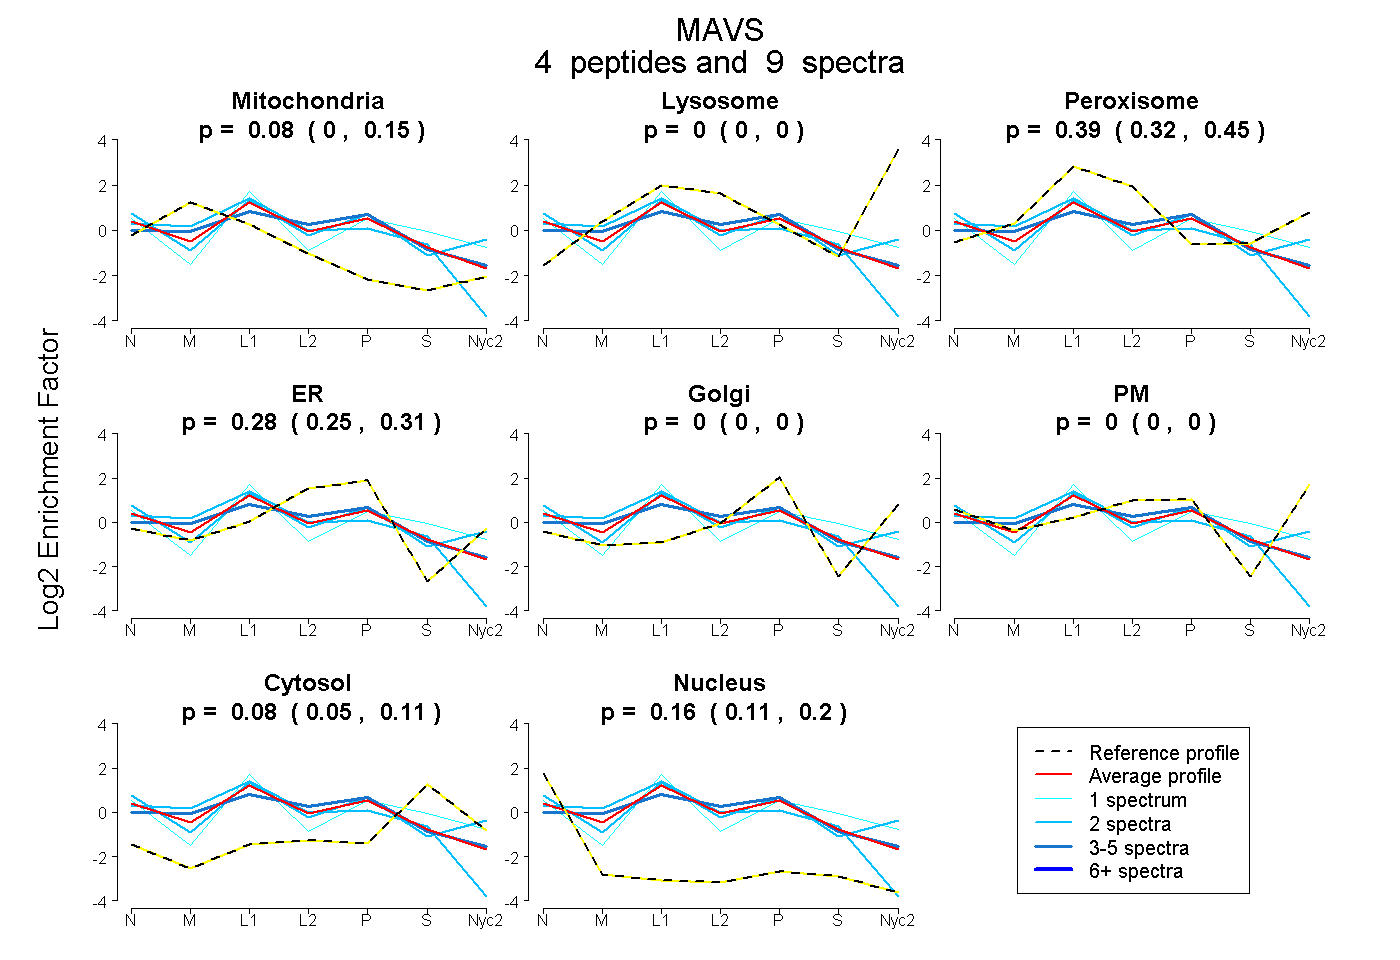
| Expt A |
4 peptides |
9 spectra |
|
0.081 0.001 | 0.148 |
0.000 0.000 | 0.000 |
0.389 0.323 | 0.448 |
0.282 0.248 | 0.312 |
0.000 0.000 | 0.000 |
0.000 0.000 | 0.000 |
0.084 0.050 | 0.110 |
0.164 0.115 | 0.203 |
| 4 spectra, RPGWVEVFIR | 0.247 | 0.000 | 0.188 | 0.404 | 0.000 | 0.000 | 0.161 | 0.000 | ||
| 1 spectrum, AATCVSTK | 0.000 | 0.000 | 0.482 | 0.000 | 0.150 | 0.000 | 0.223 | 0.145 | ||
| 2 spectra, ICELPGLAEQVTR | 0.450 | 0.000 | 0.213 | 0.180 | 0.000 | 0.000 | 0.069 | 0.088 | ||
| 2 spectra, ASASTMPPER | 0.000 | 0.000 | 0.499 | 0.007 | 0.313 | 0.000 | 0.000 | 0.181 |
| Plot | Mito | Lyso or Perox | ER | Golgi | PM | Cytosol | Nucleus | ||||||
| Expt B |
2 peptides |
2 spectra |
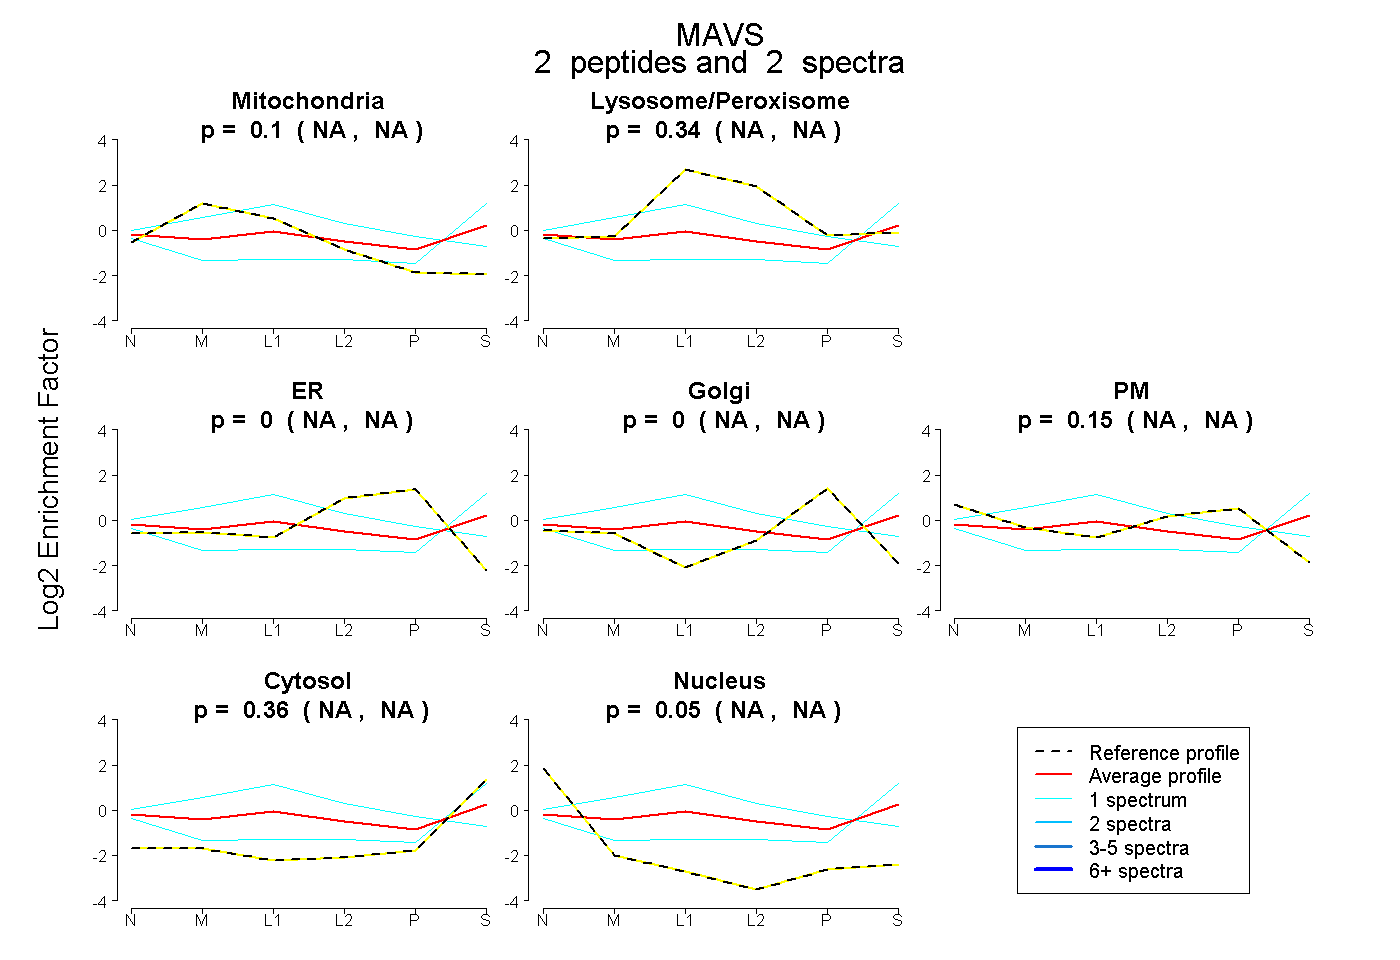 |
0.100 NA | NA |
0.338 NA | NA |
0.000 NA | NA |
0.000 NA | NA |
0.153 NA | NA |
0.357 NA | NA |
0.052 NA | NA |
|||
| Plot | Lyso | Other | |||||||||||
| Expt C |
6 peptides |
19 spectra |
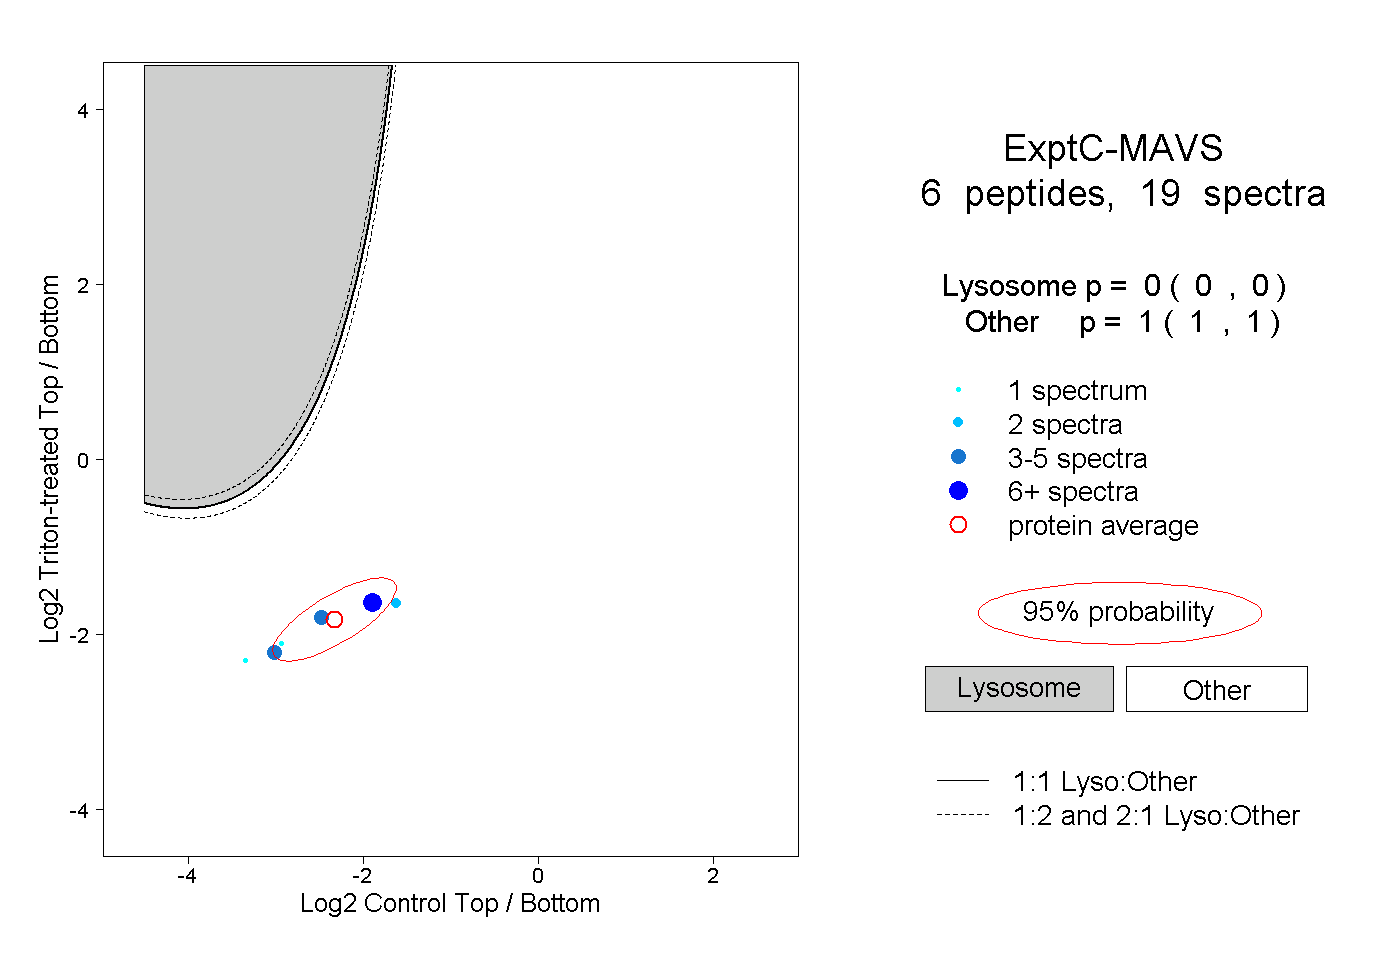 |
0.000 0.000 | 0.000 |
1.000 1.000 | 1.000 |
||||||||
| Plot | Lyso | Other | |||||||||||
| Expt D |
2 peptides |
4 spectra |
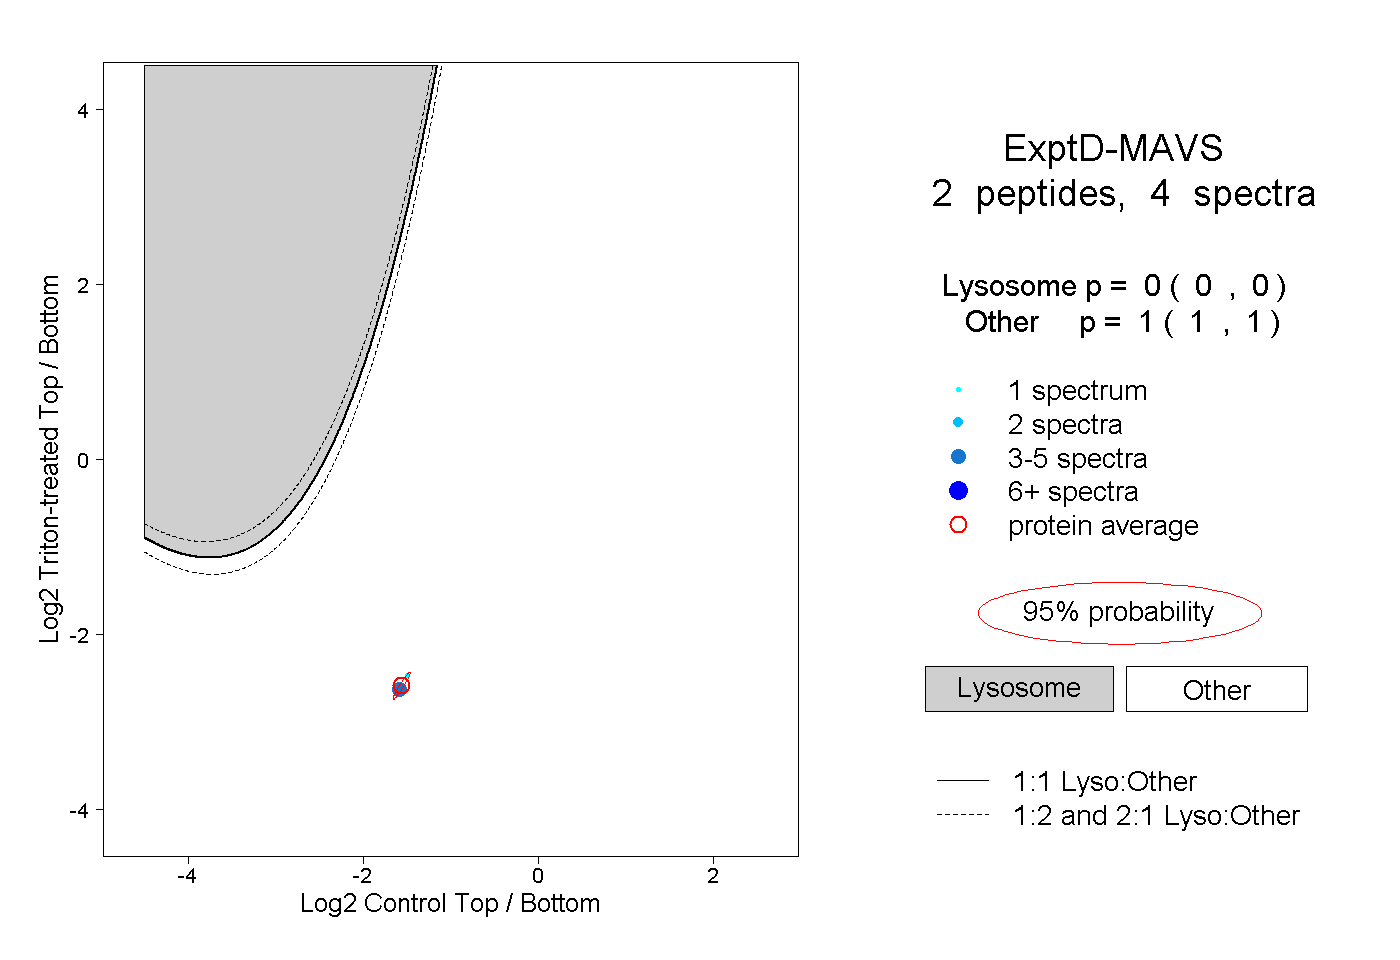 |
0.000 0.000 | 0.000 |
1.000 1.000 | 1.000 |