 2
2peptides
spectra
0.000 | 0.000
0.033 | 0.089
0.000 | 0.000
0.000 | 0.000
0.382 | 0.463
0.440 | 0.508
0.000 | 0.067
0.000 | 0.000
1peptide
spectra
0.000 | 0.000
1.000 | 1.000
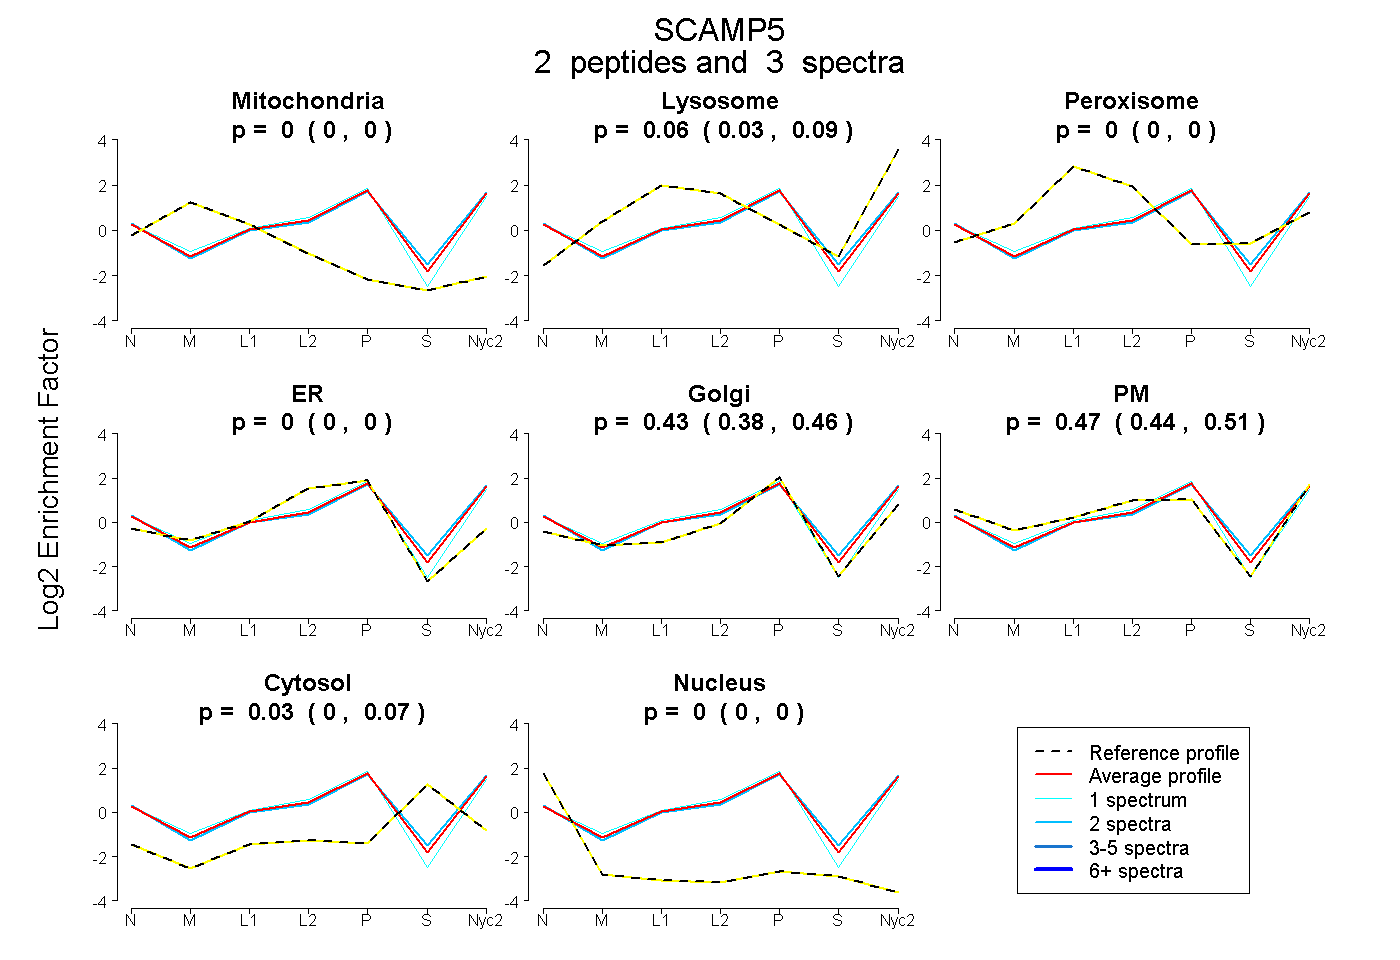
| Plot | Mito | Lyso | Perox | ER | Golgi | PM | Cytosol | Nucleus | |||||
| Expt A |
2 peptides |
3 spectra |
|
0.000 0.000 | 0.000 |
0.065 0.033 | 0.089 |
0.000 0.000 | 0.000 |
0.000 0.000 | 0.000 |
0.428 0.382 | 0.463 |
0.475 0.440 | 0.508 |
0.033 0.000 | 0.067 |
0.000 0.000 | 0.000 |
||
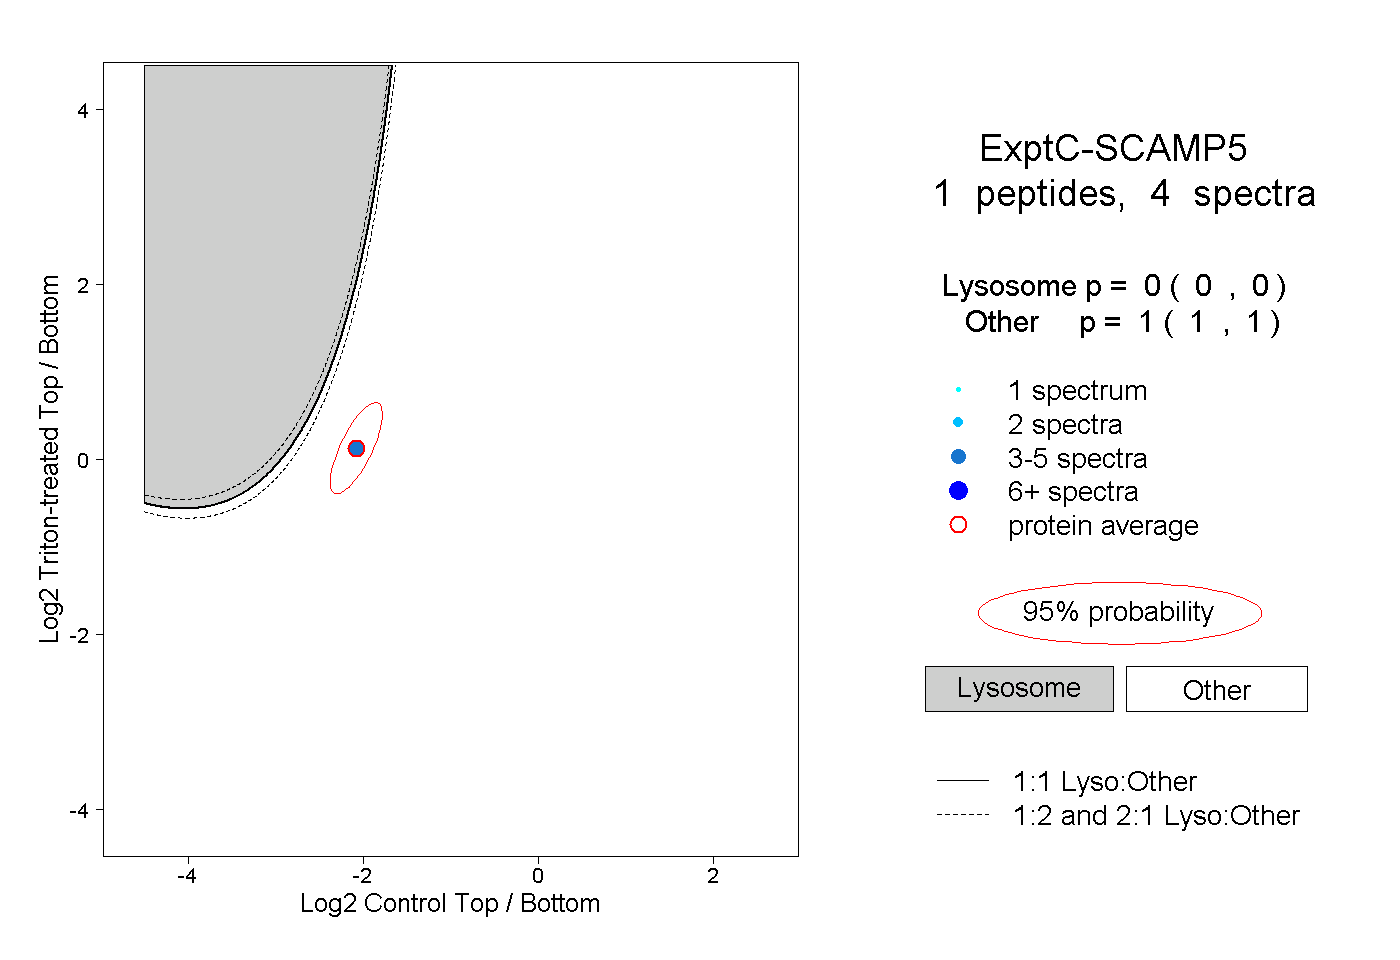
| Plot | Lyso | Other | |||||||||||
| Expt C |
1 peptide |
4 spectra |
|
0.000 0.000 | 0.000 |
1.000 1.000 | 1.000 |