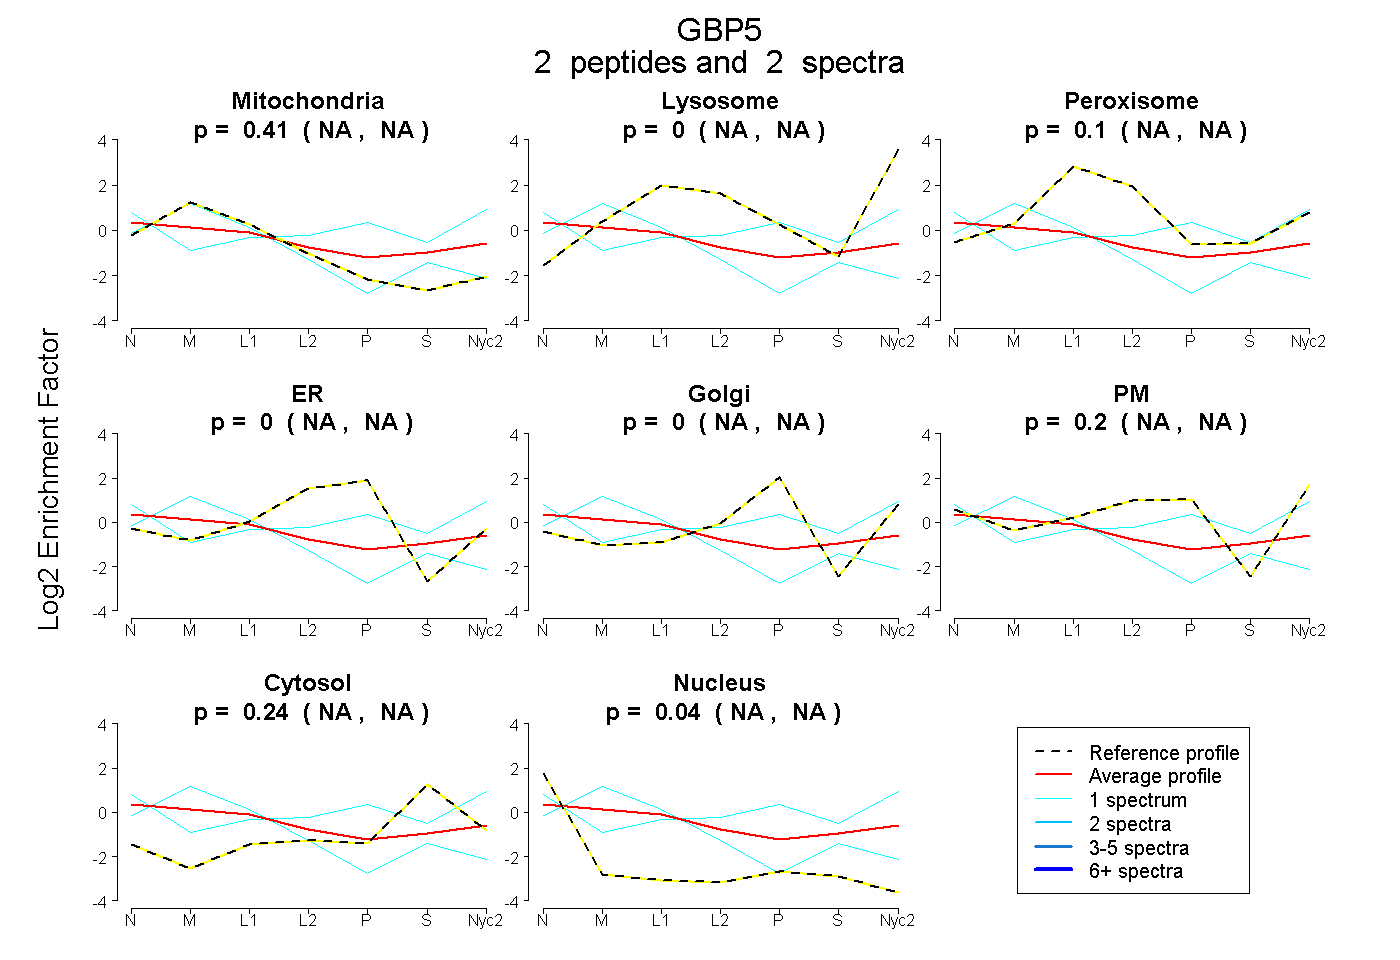
 2
2peptides
spectra
NA | NA
NA | NA
NA | NA
NA | NA
NA | NA
NA | NA
NA | NA
NA | NA
| Plot | Mito | Lyso | Perox | ER | Golgi | PM | Cytosol | Nucleus | |||||
| Expt A |
2 peptides |
2 spectra |
|
0.410 NA | NA |
0.000 NA | NA |
0.100 NA | NA |
0.000 NA | NA |
0.000 NA | NA |
0.202 NA | NA |
0.244 NA | NA |
0.043 NA | NA |
| 1 spectrum, AEQEAQLR | 0.867 | 0.000 | 0.000 | 0.000 | 0.000 | 0.000 | 0.133 | 0.000 | ||
| 1 spectrum, ELESLLSAK | 0.000 | 0.000 | 0.000 | 0.000 | 0.000 | 0.642 | 0.345 | 0.013 |
| Plot | Lyso | Other | |||||||||||
| Expt C |
1 peptide |
4 spectra |
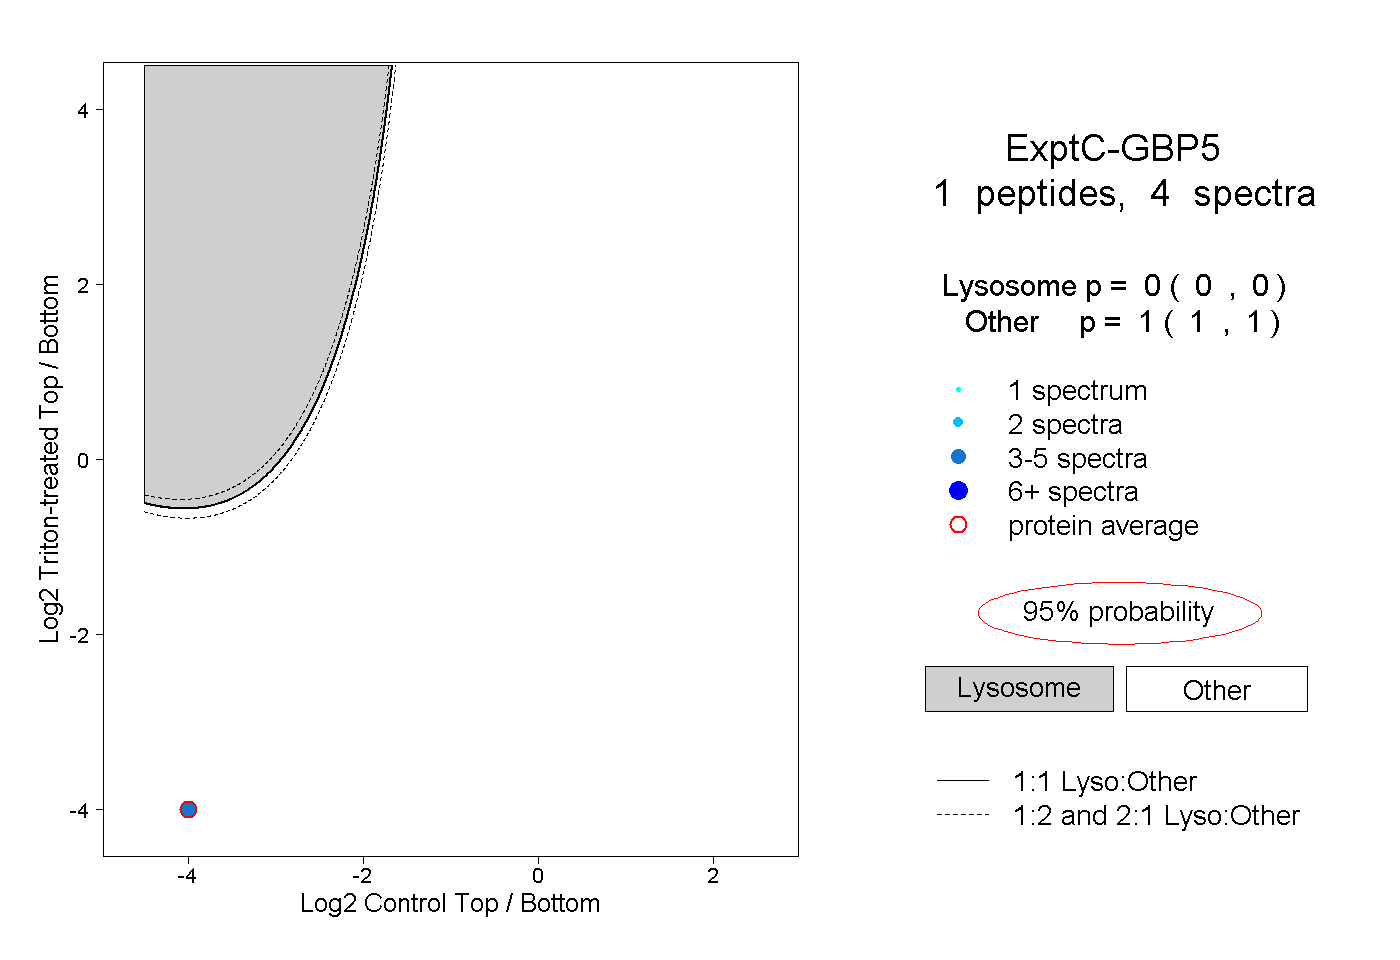 |
0.000 0.000 | 0.000 |
1.000 1.000 | 1.000 |