 4
4peptides
spectra
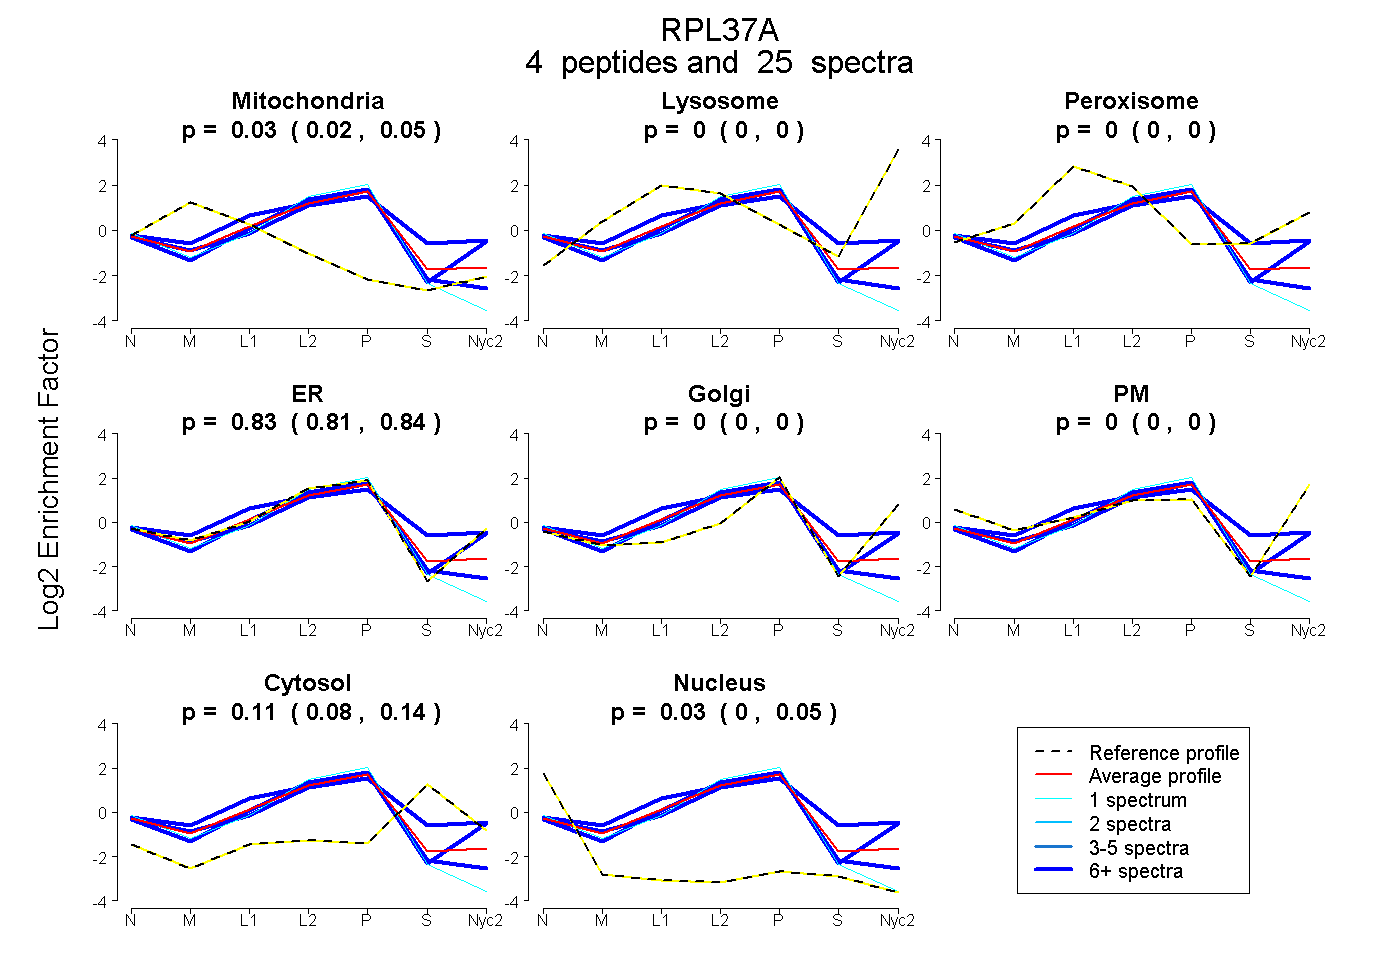
0.016 | 0.048
0.000 | 0.000
0.000 | 0.000
0.809 | 0.845
0.000 | 0.000
0.000 | 0.000
0.075 | 0.140
0.003 | 0.048
1peptide
spectrum
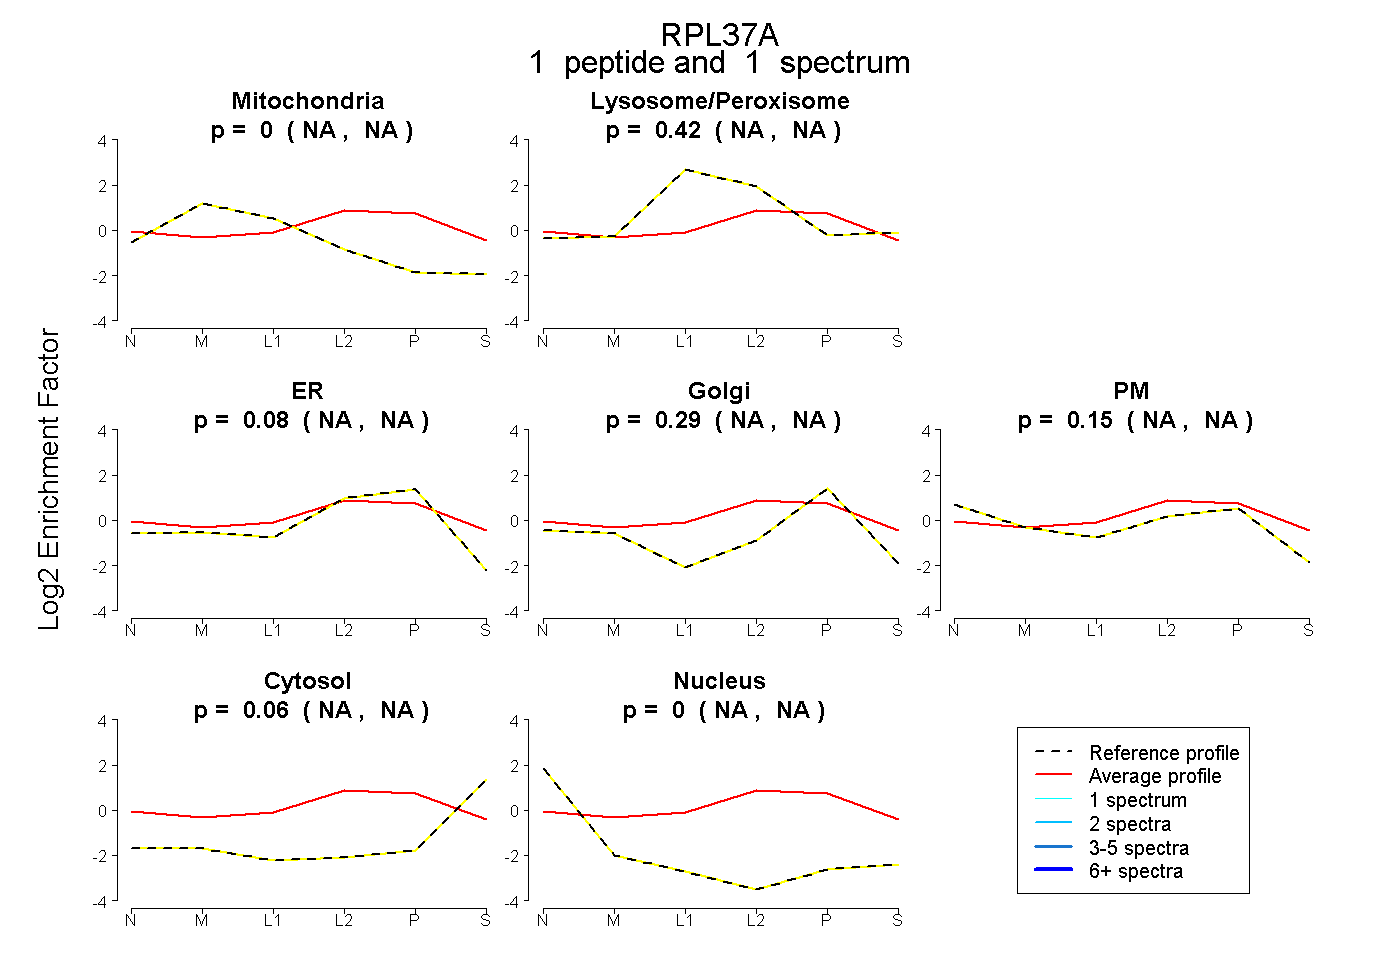
NA | NA
NA | NA
NA | NA
NA | NA
NA | NA
NA | NA
NA | NA
5peptides
spectra
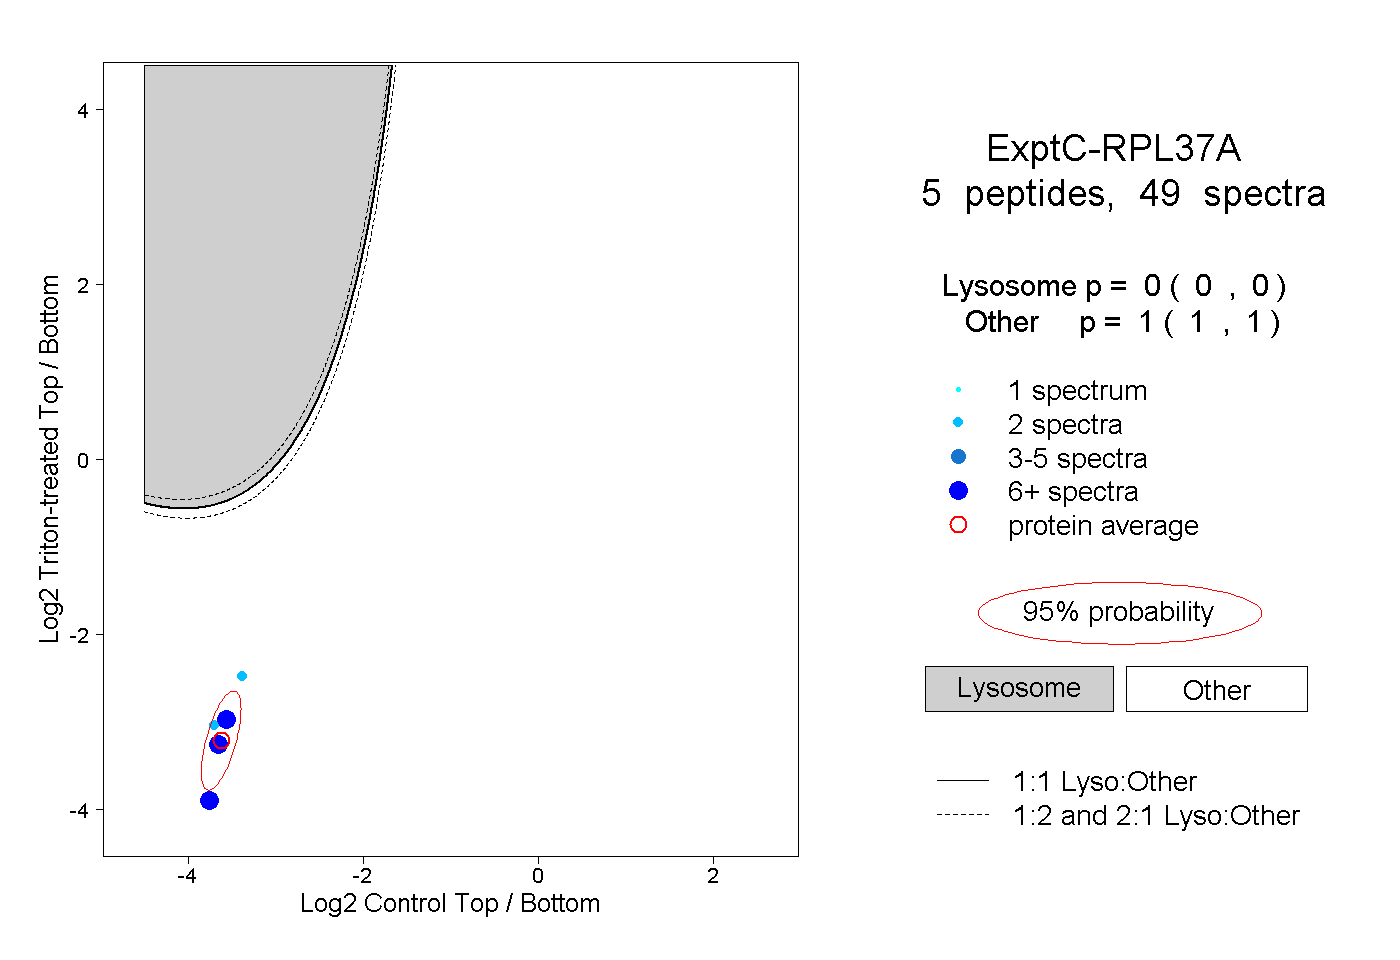
0.000 | 0.000
1.000 | 1.000
2peptides
spectra
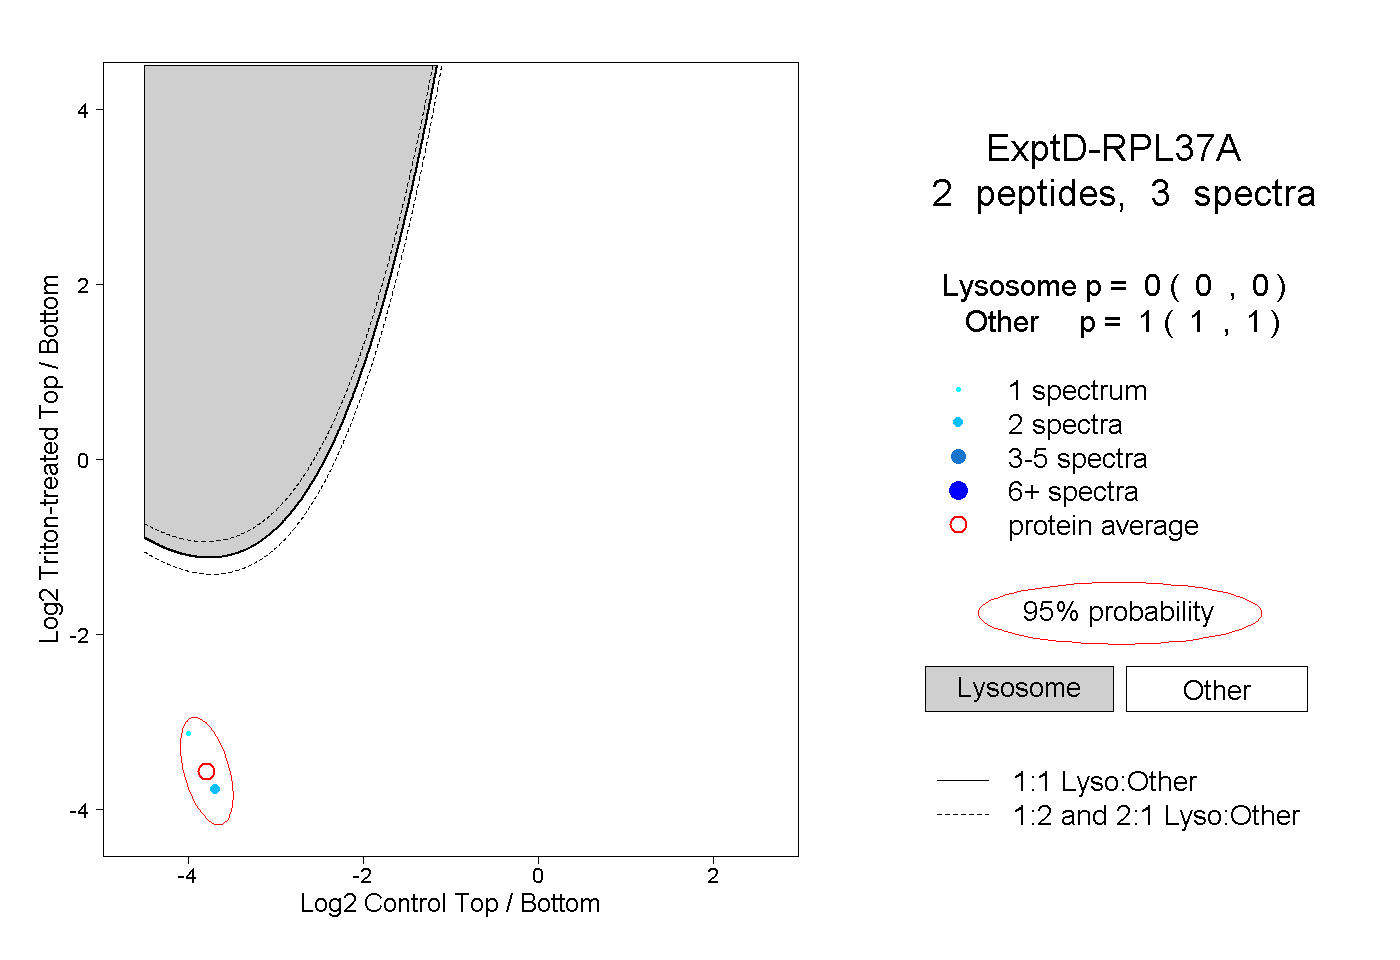
0.000 | 0.000
1.000 | 1.000