 2
2peptides
spectra
0.000 | 0.000
0.001 | 0.070
0.000 | 0.000
0.000 | 0.000
0.000 | 0.000
0.846 | 0.905
0.067 | 0.095
0.000 | 0.000
5peptides
spectra
0.000 | 0.000
1.000 | 1.000
| Plot | Mito | Lyso | Perox | ER | Golgi | PM | Cytosol | Nucleus | |||||
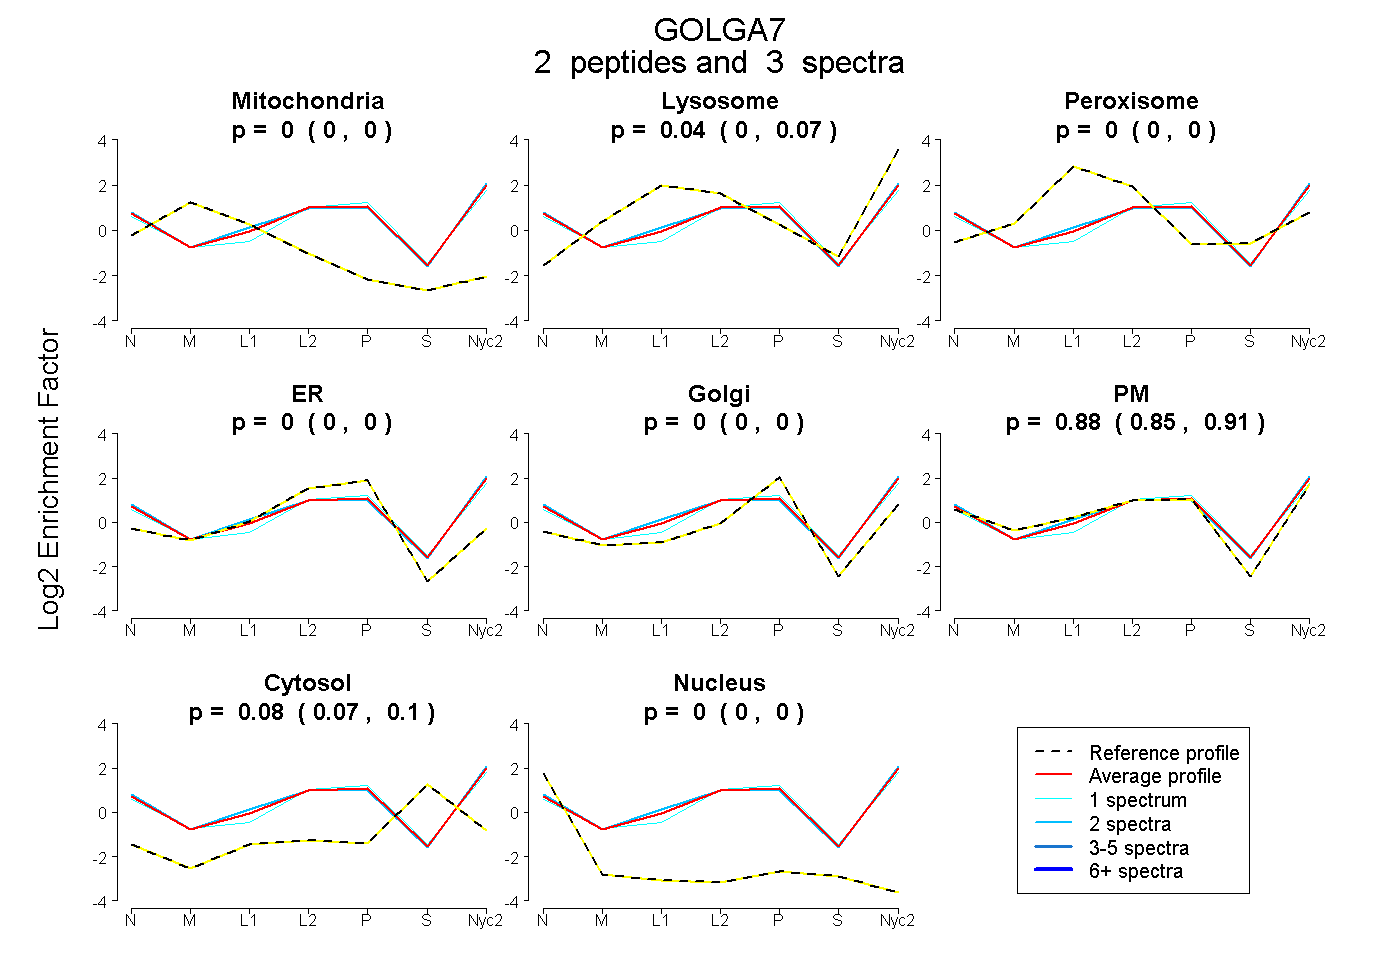
| Expt A |
2 peptides |
3 spectra |
|
0.000 0.000 | 0.000 |
0.039 0.001 | 0.070 |
0.000 0.000 | 0.000 |
0.000 0.000 | 0.000 |
0.000 0.000 | 0.000 |
0.879 0.846 | 0.905 |
0.082 0.067 | 0.095 |
0.000 0.000 | 0.000 |
||
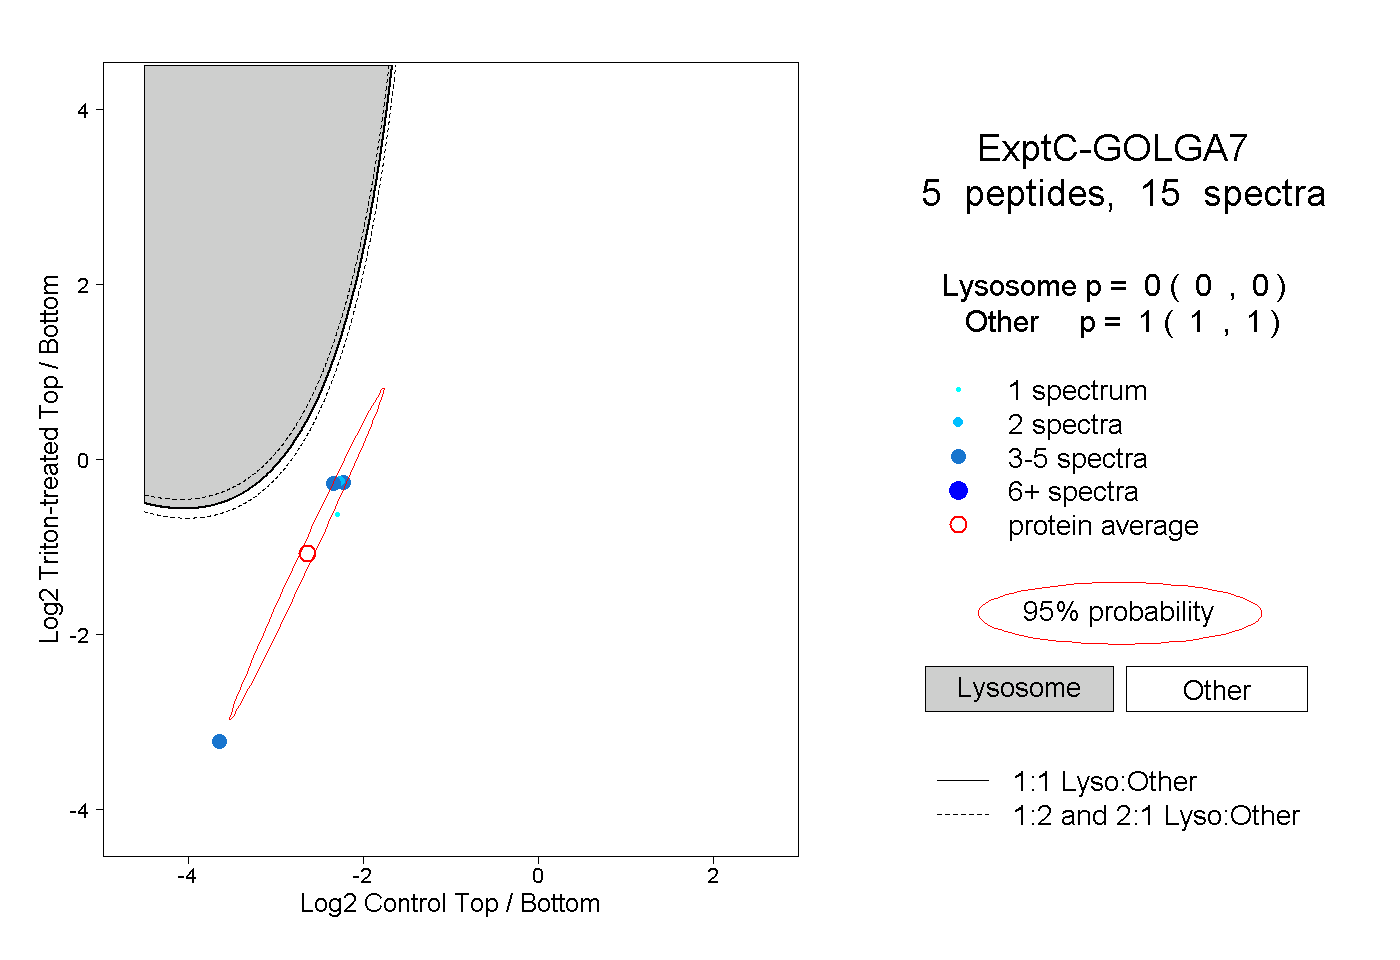
| Plot | Lyso | Other | |||||||||||
| Expt C |
5 peptides |
15 spectra |
|
0.000 0.000 | 0.000 |
1.000 1.000 | 1.000 |
| 4 spectra, YIQEQNEK | 0.000 | 1.000 | ||||||||
| 2 spectra, QQFEETVR | 0.000 | 1.000 | ||||||||
| 1 spectrum, IYAPQGLLLTDPIER | 0.000 | 1.000 | ||||||||
| 4 spectra, CQFQTK | 0.000 | 1.000 | ||||||||
| 4 spectra, FPAELENR | 0.000 | 1.000 |