 1
1peptide
spectra
0.000 | 0.000
0.000 | 0.037
0.000 | 0.056
0.000 | 0.241
0.000 | 0.000
0.487 | 0.814
0.149 | 0.221
0.000 | 0.000
1peptide
spectra
0.000 | 0.000
1.000 | 1.000
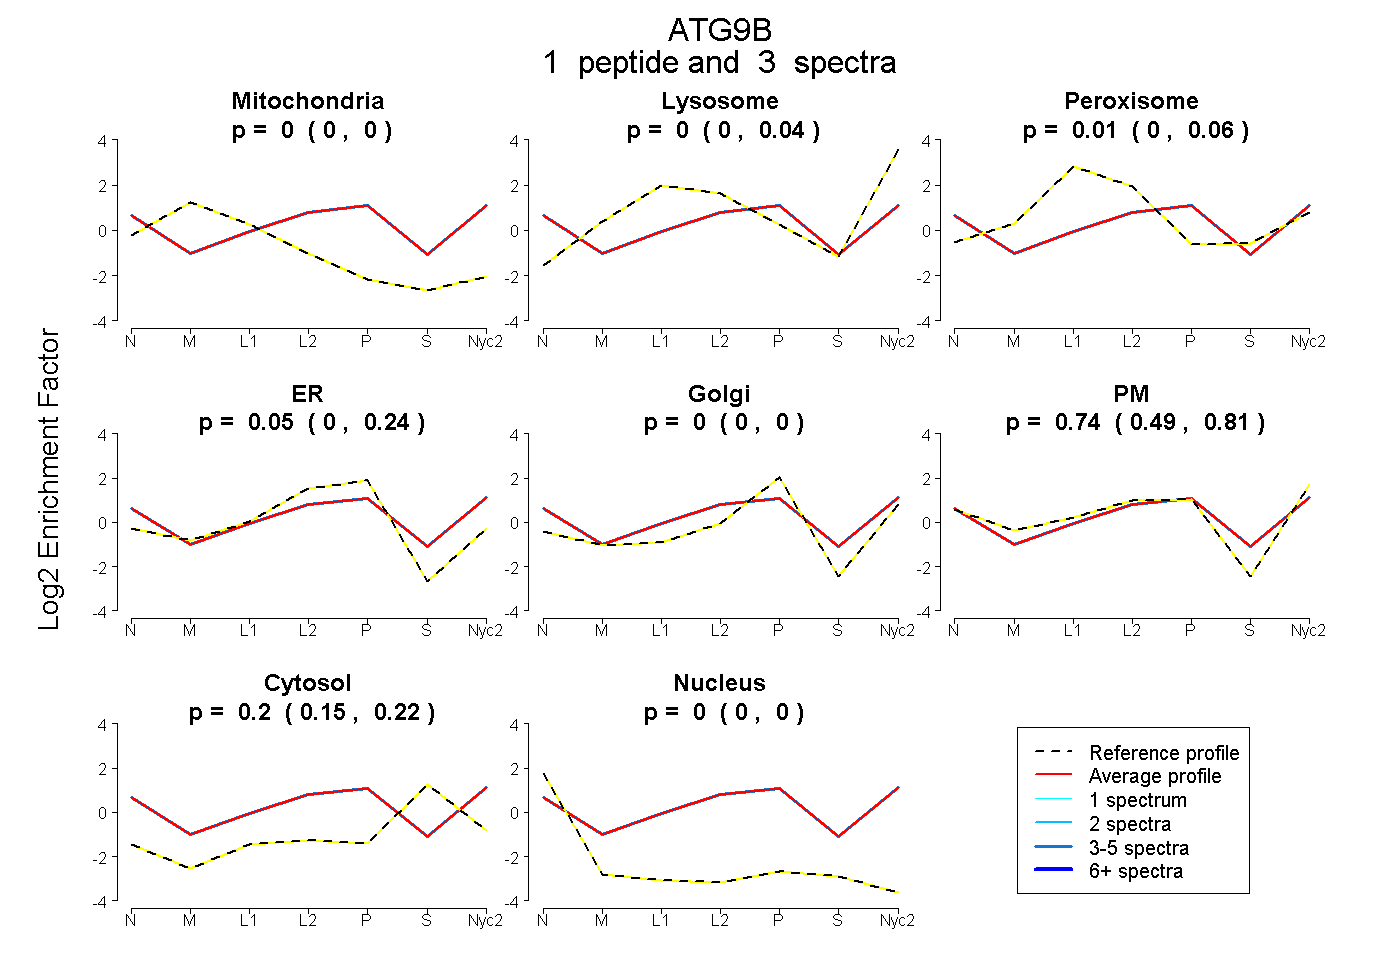
| Plot | Mito | Lyso | Perox | ER | Golgi | PM | Cytosol | Nucleus | |||||
| Expt A |
1 peptide |
3 spectra |
|
0.000 0.000 | 0.000 |
0.000 0.000 | 0.037 |
0.010 0.000 | 0.056 |
0.051 0.000 | 0.241 |
0.000 0.000 | 0.000 |
0.743 0.487 | 0.814 |
0.196 0.149 | 0.221 |
0.000 0.000 | 0.000 |
||
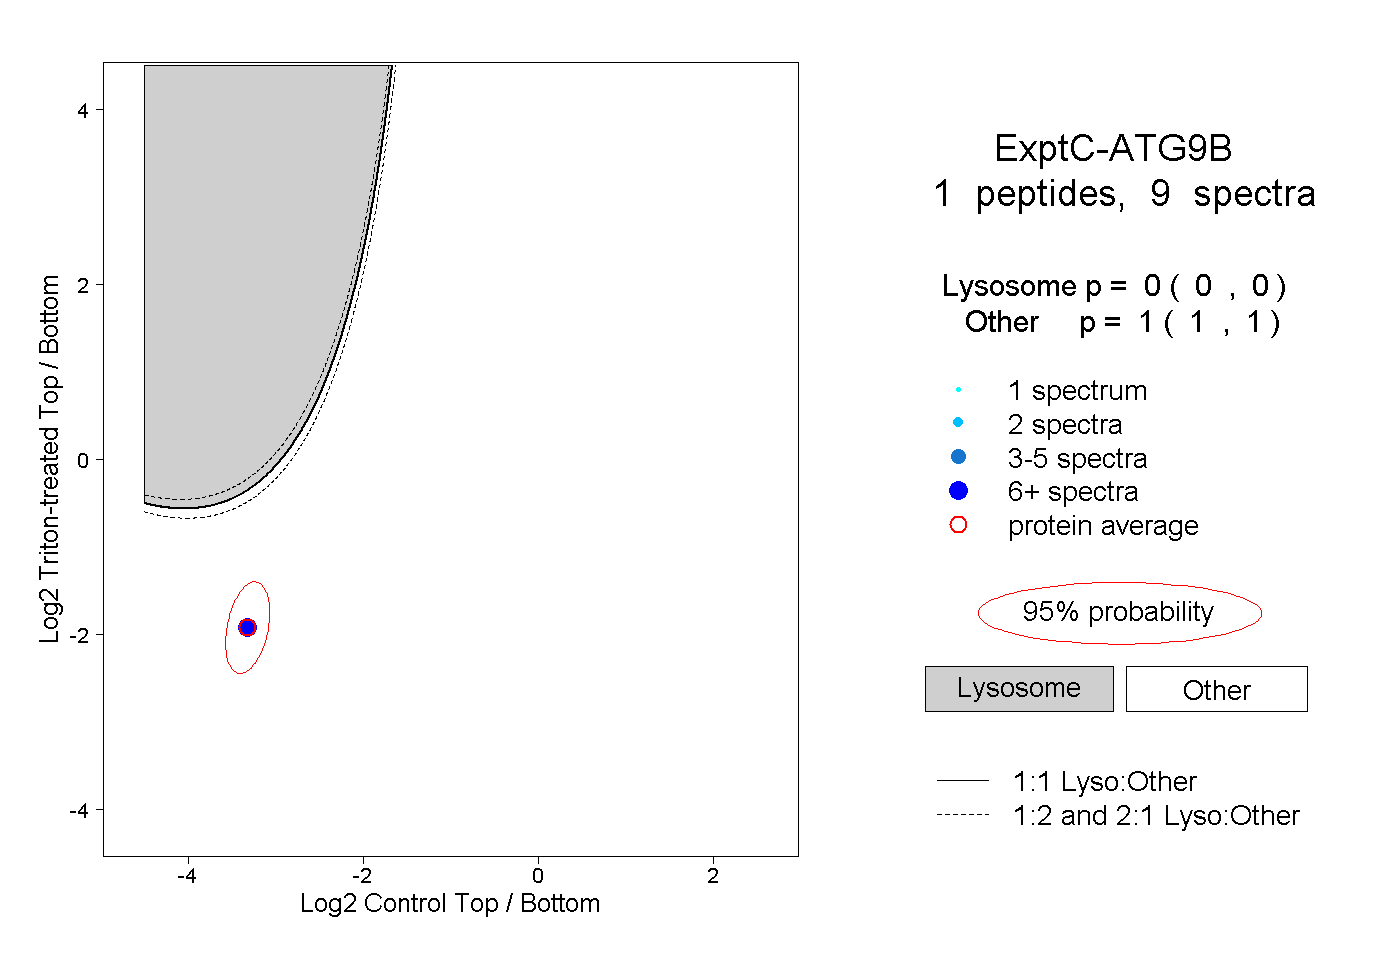
| Plot | Lyso | Other | |||||||||||
| Expt C |
1 peptide |
9 spectra |
|
0.000 0.000 | 0.000 |
1.000 1.000 | 1.000 |