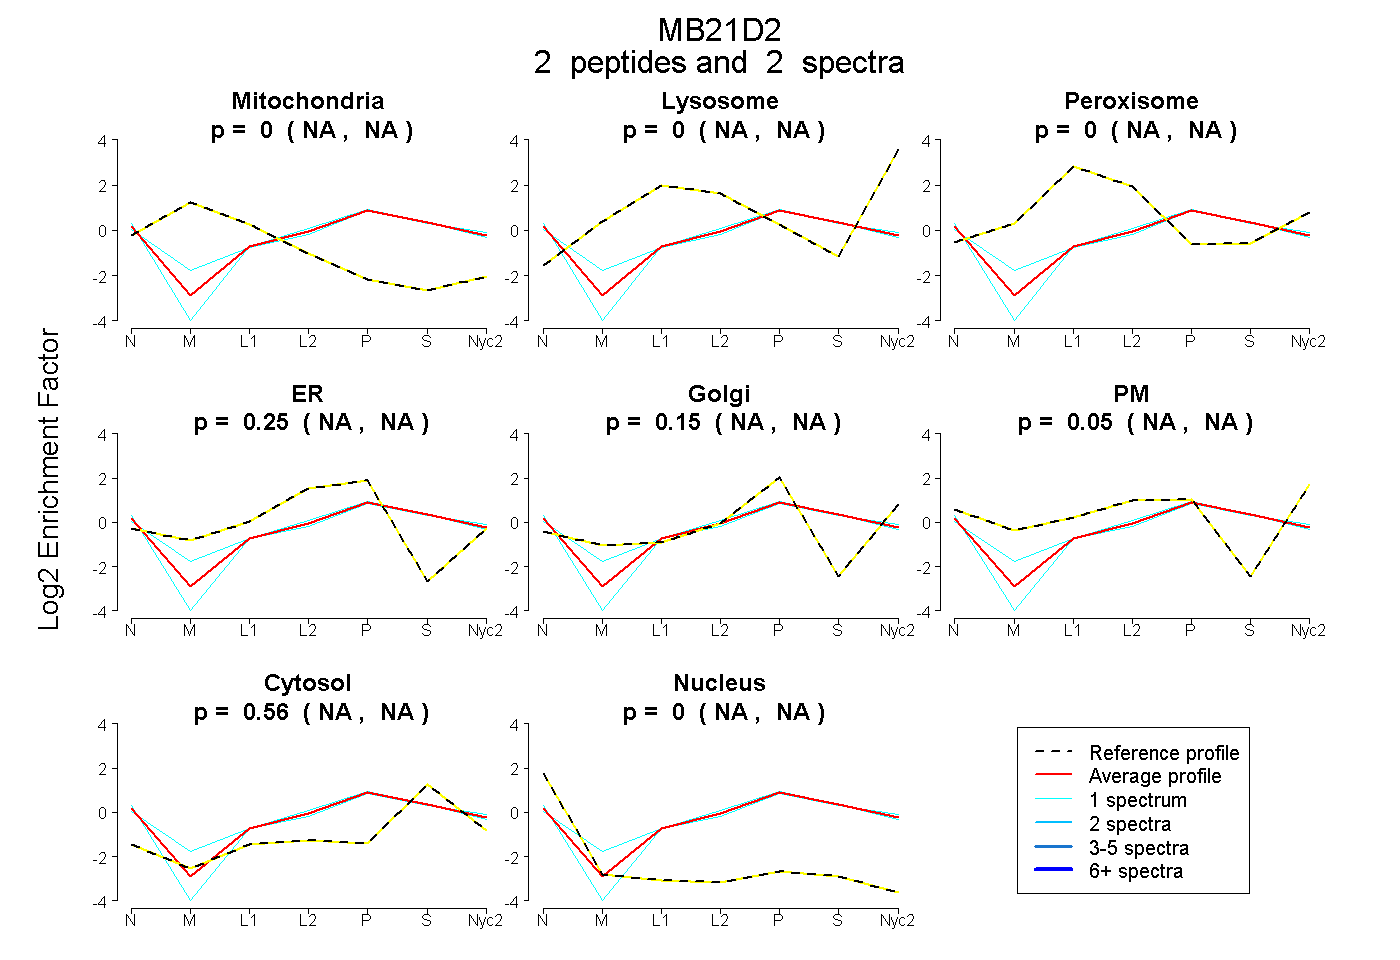
 2
2peptides
spectra
NA | NA
NA | NA
NA | NA
NA | NA
NA | NA
NA | NA
NA | NA
NA | NA
| Plot | Mito | Lyso | Perox | ER | Golgi | PM | Cytosol | Nucleus | |||||
| Expt A |
2 peptides |
2 spectra |
|
0.000 NA | NA |
0.000 NA | NA |
0.000 NA | NA |
0.247 NA | NA |
0.149 NA | NA |
0.049 NA | NA |
0.555 NA | NA |
0.000 NA | NA |
| 1 spectrum, TAIEHVK | 0.000 | 0.000 | 0.000 | 0.307 | 0.093 | 0.000 | 0.600 | 0.000 | ||
| 1 spectrum, LPVANEYLLLSGGVR | 0.000 | 0.000 | 0.000 | 0.151 | 0.154 | 0.181 | 0.514 | 0.000 |
| Plot | Lyso | Other | |||||||||||
| Expt C |
3 peptides |
8 spectra |
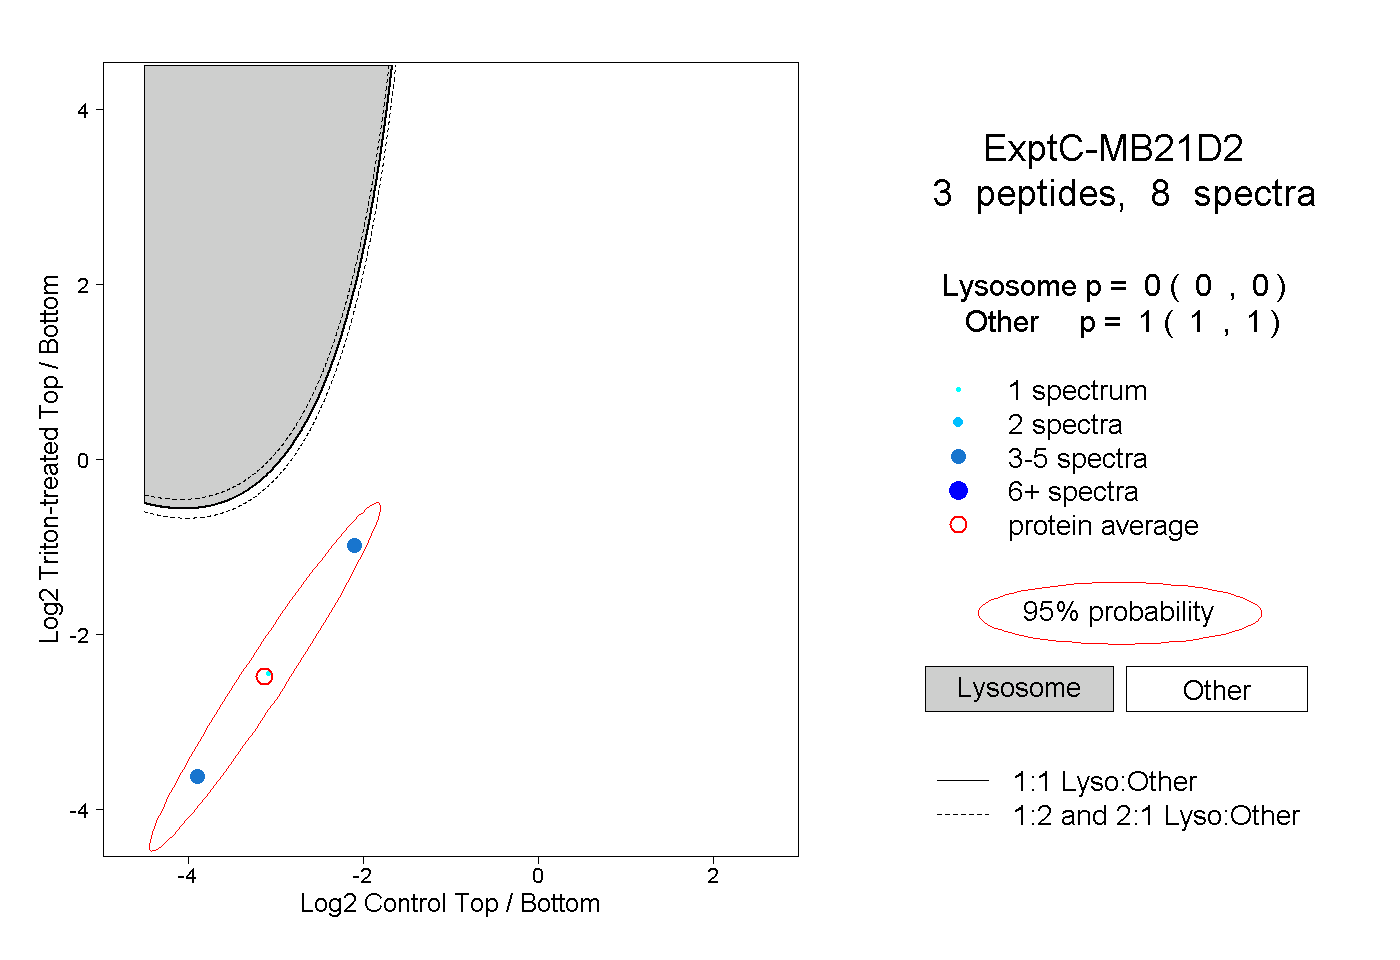 |
0.000 0.000 | 0.000 |
1.000 1.000 | 1.000 |
||||||||
| Plot | Lyso | Other | |||||||||||
| Expt D |
1 peptide |
2 spectra |
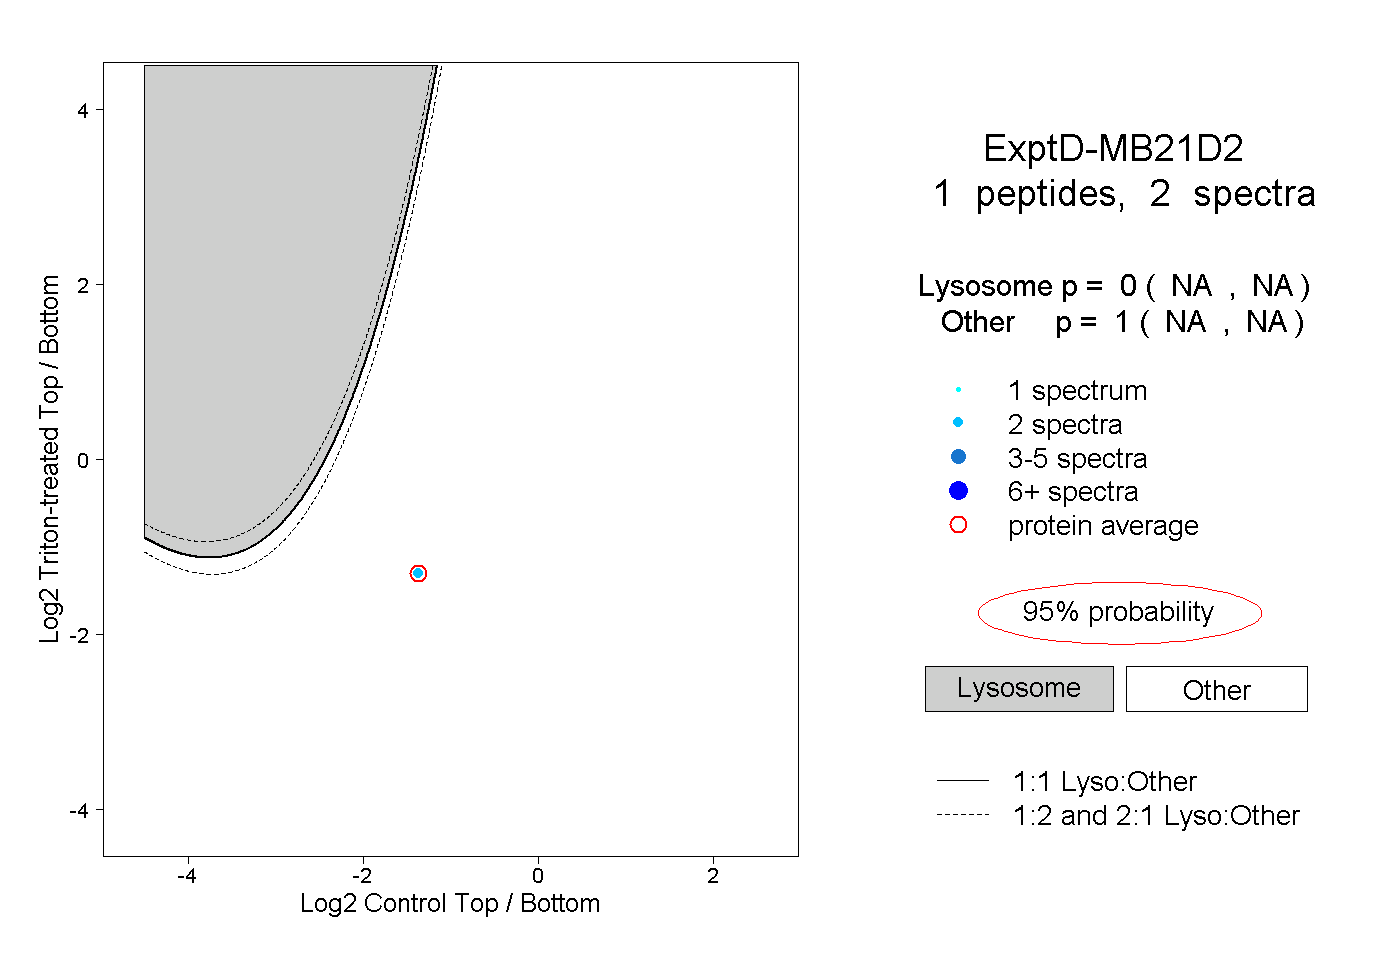 |
0.000 NA | NA |
1.000 NA | NA |