 4
4peptides
spectra
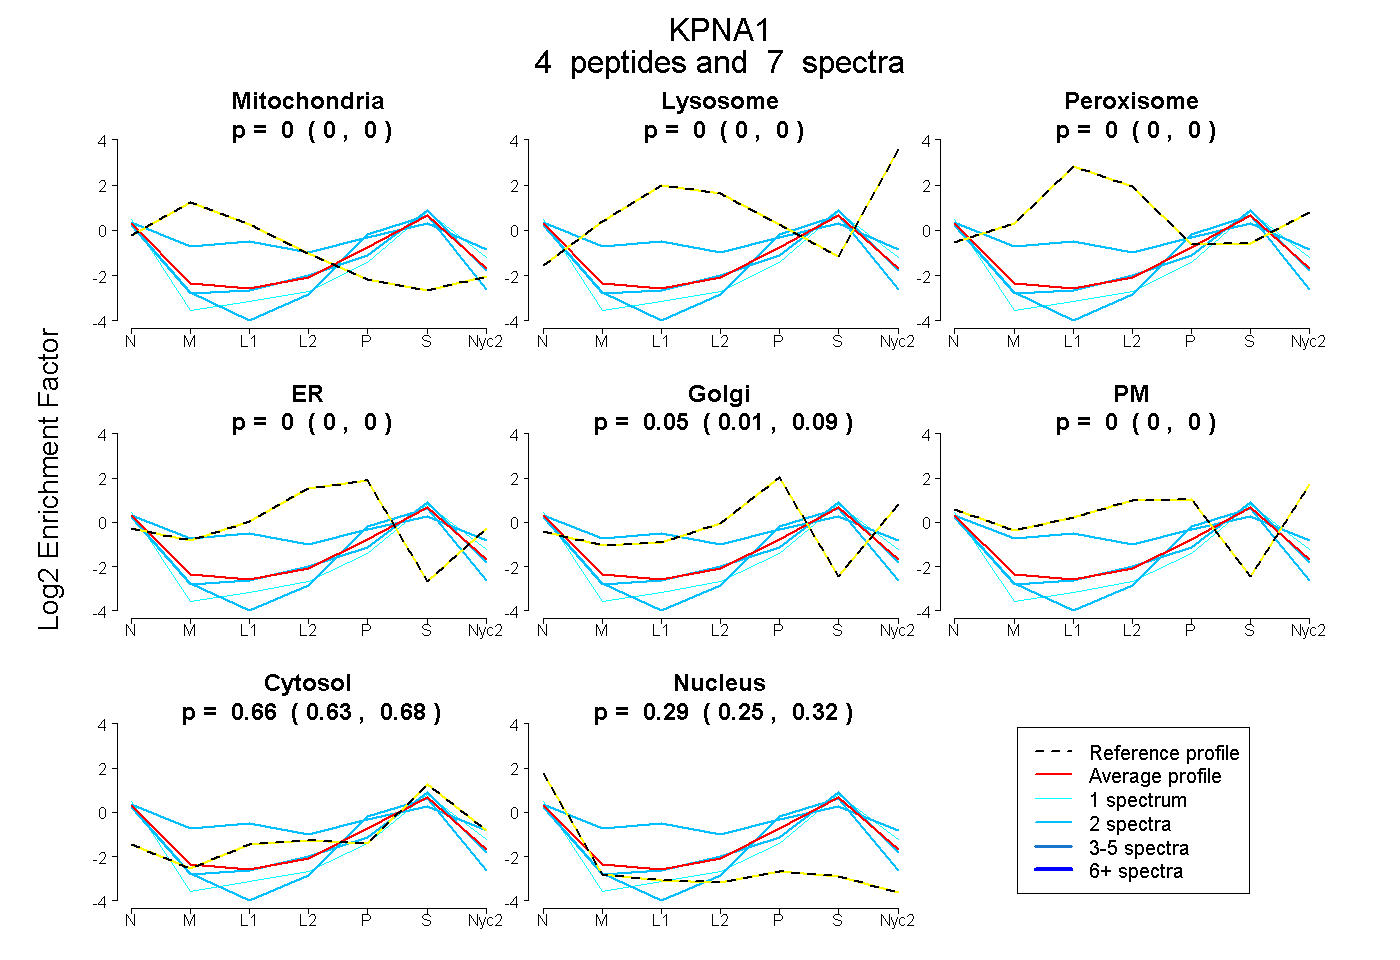
0.000 | 0.000
0.000 | 0.000
0.000 | 0.000
0.000 | 0.000
0.009 | 0.090
0.000 | 0.000
0.629 | 0.683
0.247 | 0.324
| Plot | Mito | Lyso | Perox | ER | Golgi | PM | Cytosol | Nucleus | |||||
| Expt A |
4 peptides |
7 spectra |
|
0.000 0.000 | 0.000 |
0.000 0.000 | 0.000 |
0.000 0.000 | 0.000 |
0.000 0.000 | 0.000 |
0.052 0.009 | 0.090 |
0.000 0.000 | 0.000 |
0.658 0.629 | 0.683 |
0.290 0.247 | 0.324 |
| 2 spectra, SPPPEFAK | 0.000 | 0.000 | 0.000 | 0.000 | 0.000 | 0.000 | 0.567 | 0.433 | ||
| 2 spectra, LGEQEAK | 0.140 | 0.000 | 0.096 | 0.000 | 0.020 | 0.195 | 0.484 | 0.066 | ||
| 1 spectrum, EPNPPIDEVINTPGVVAR | 0.000 | 0.000 | 0.000 | 0.000 | 0.000 | 0.000 | 0.660 | 0.340 | ||
| 2 spectra, IQAVIDAGVCR | 0.000 | 0.000 | 0.000 | 0.000 | 0.000 | 0.000 | 0.712 | 0.288 |
| Plot | Mito | Lyso or Perox | ER | Golgi | PM | Cytosol | Nucleus | ||||||
| Expt B |
1 peptide |
2 spectra |
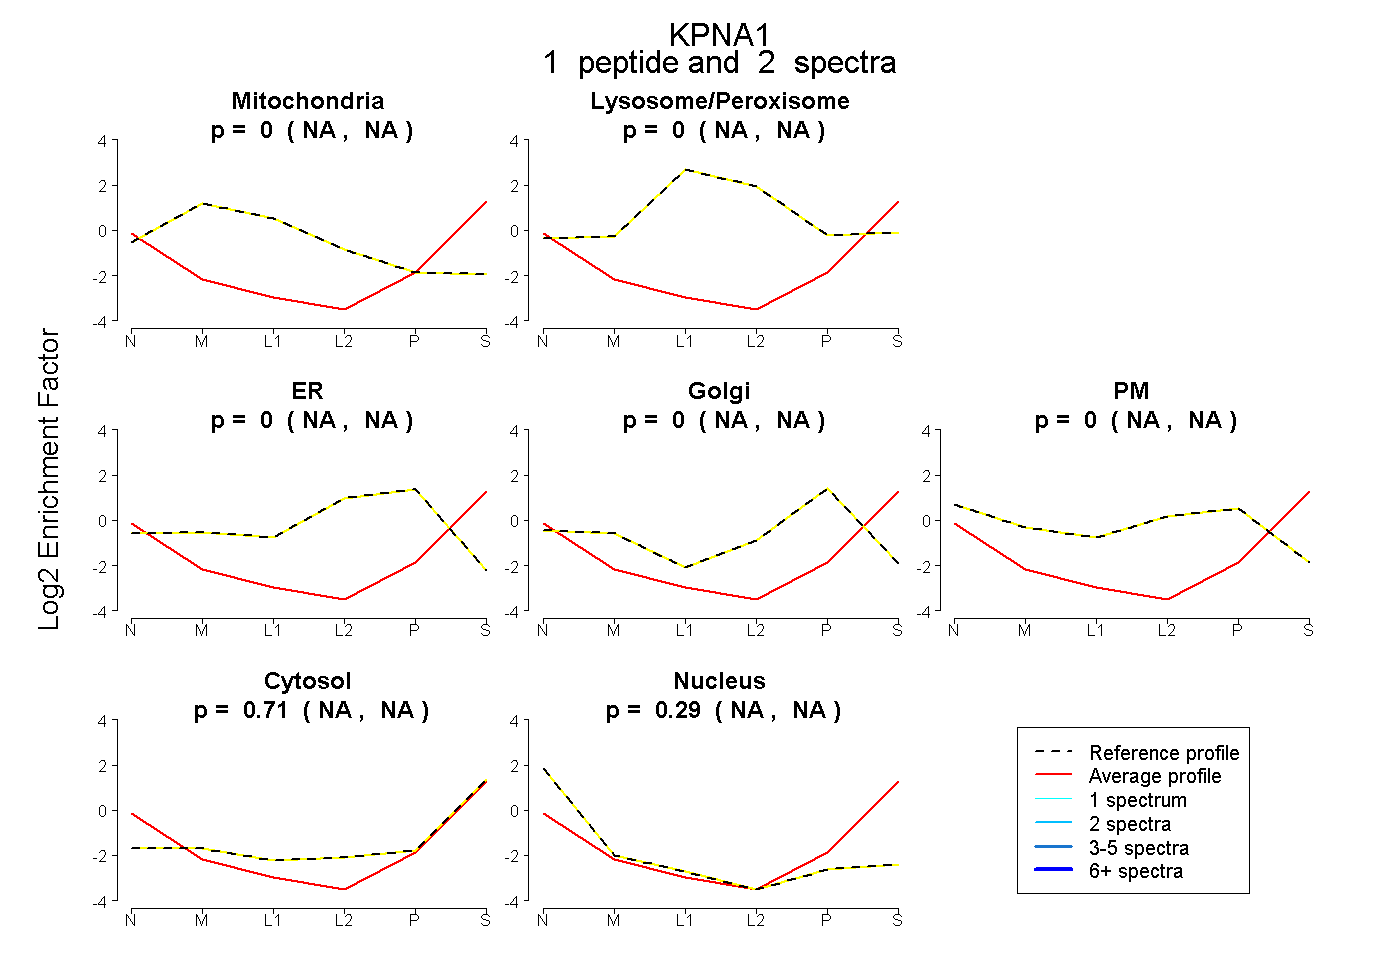 |
0.000 NA | NA |
0.000 NA | NA |
0.000 NA | NA |
0.000 NA | NA |
0.000 NA | NA |
0.714 NA | NA |
0.286 NA | NA |
|||
| Plot | Lyso | Other | |||||||||||
| Expt C |
6 peptides |
11 spectra |
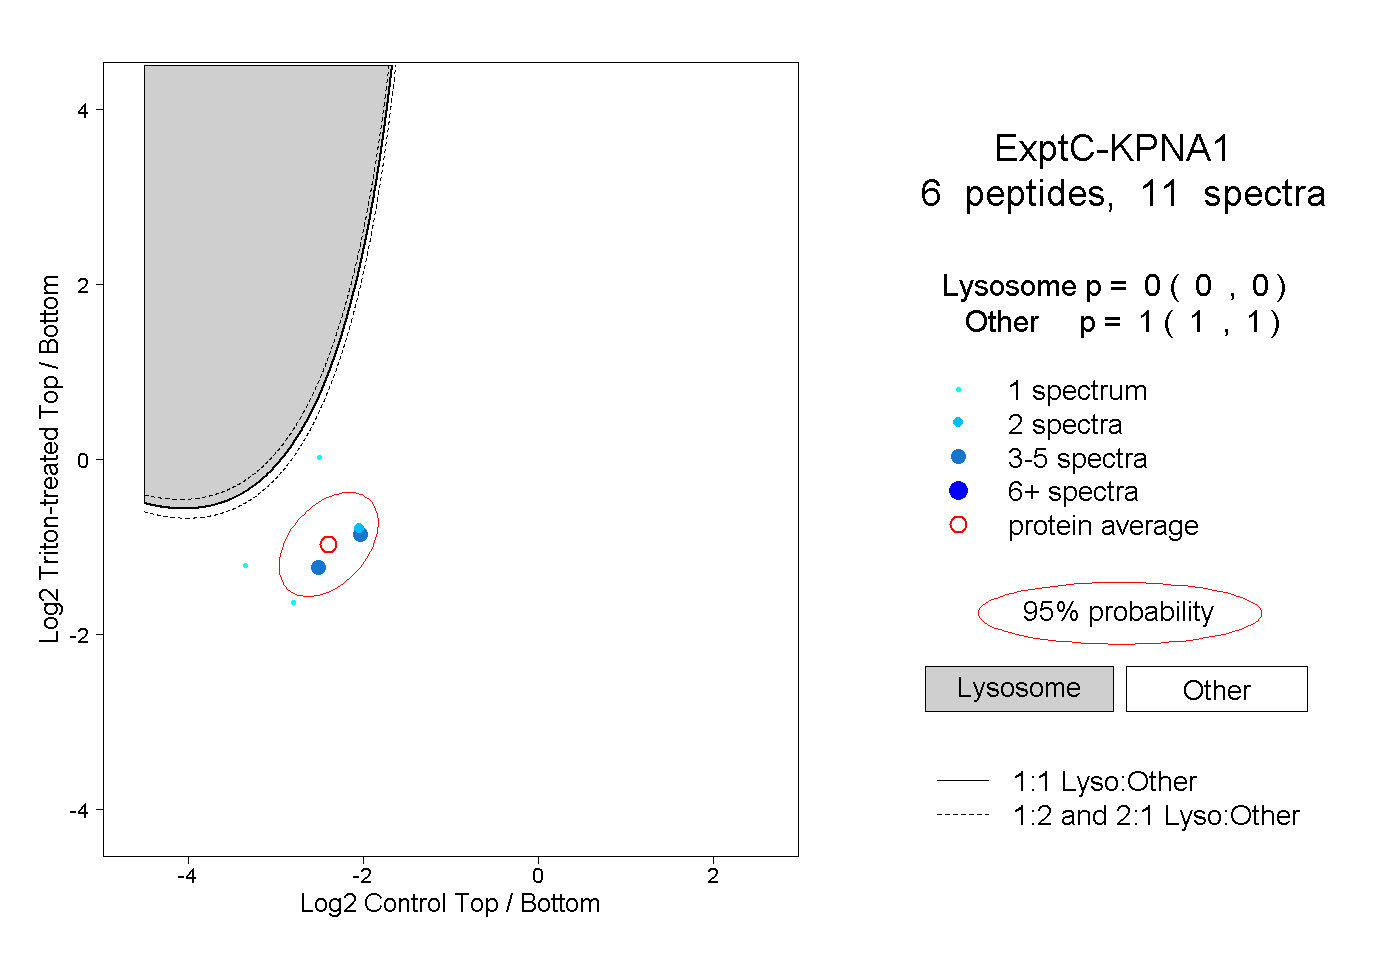 |
0.000 0.000 | 0.000 |
1.000 1.000 | 1.000 |
||||||||
| Plot | Lyso | Other | |||||||||||
| Expt D |
1 peptide |
1 spectrum |
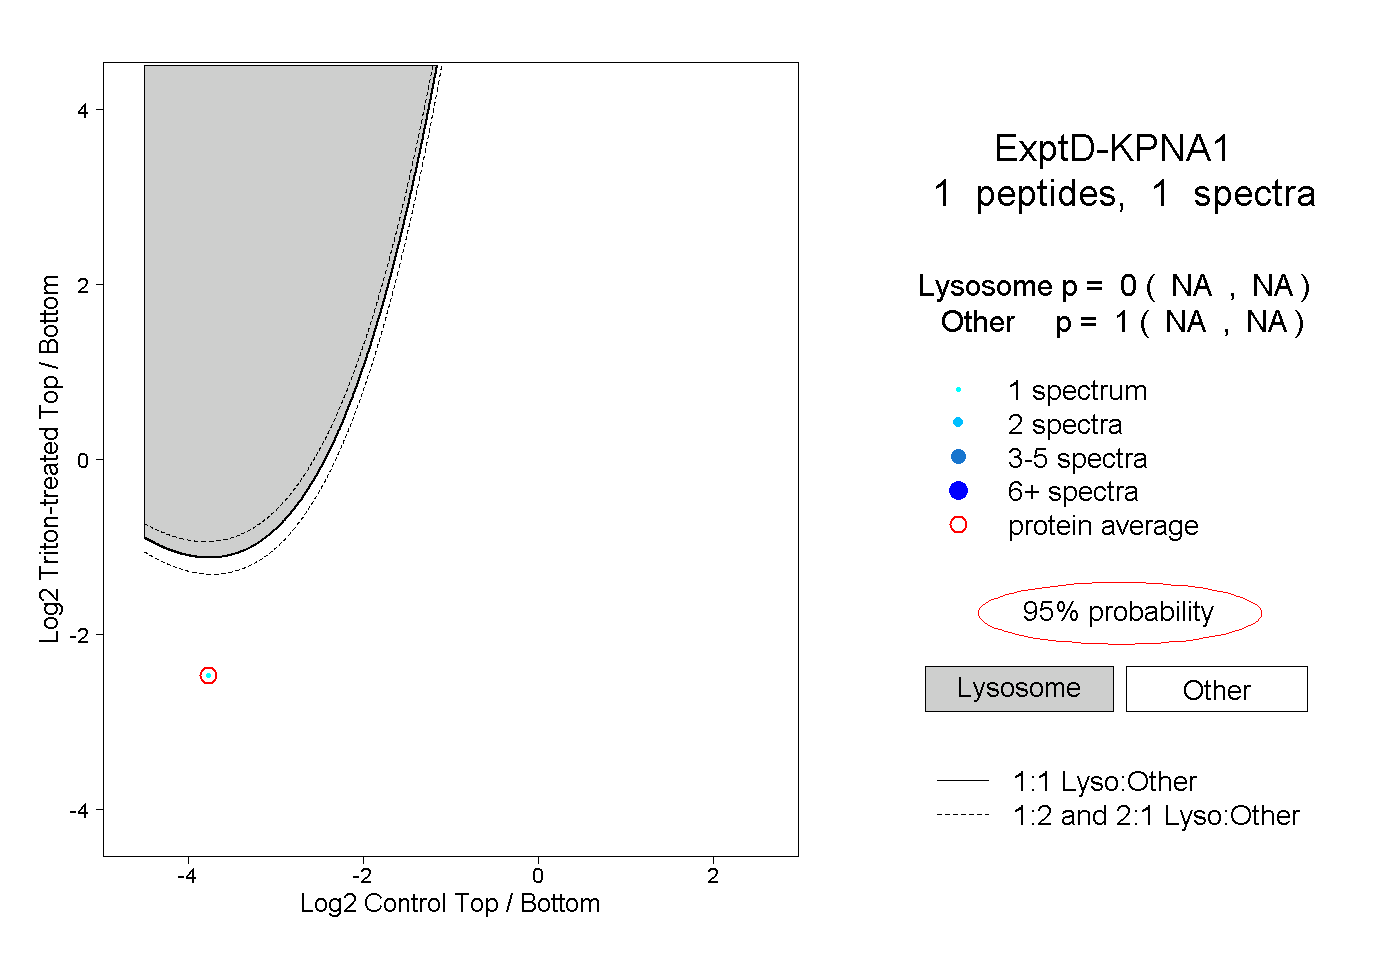 |
0.000 NA | NA |
1.000 NA | NA |