19
19peptides
spectra
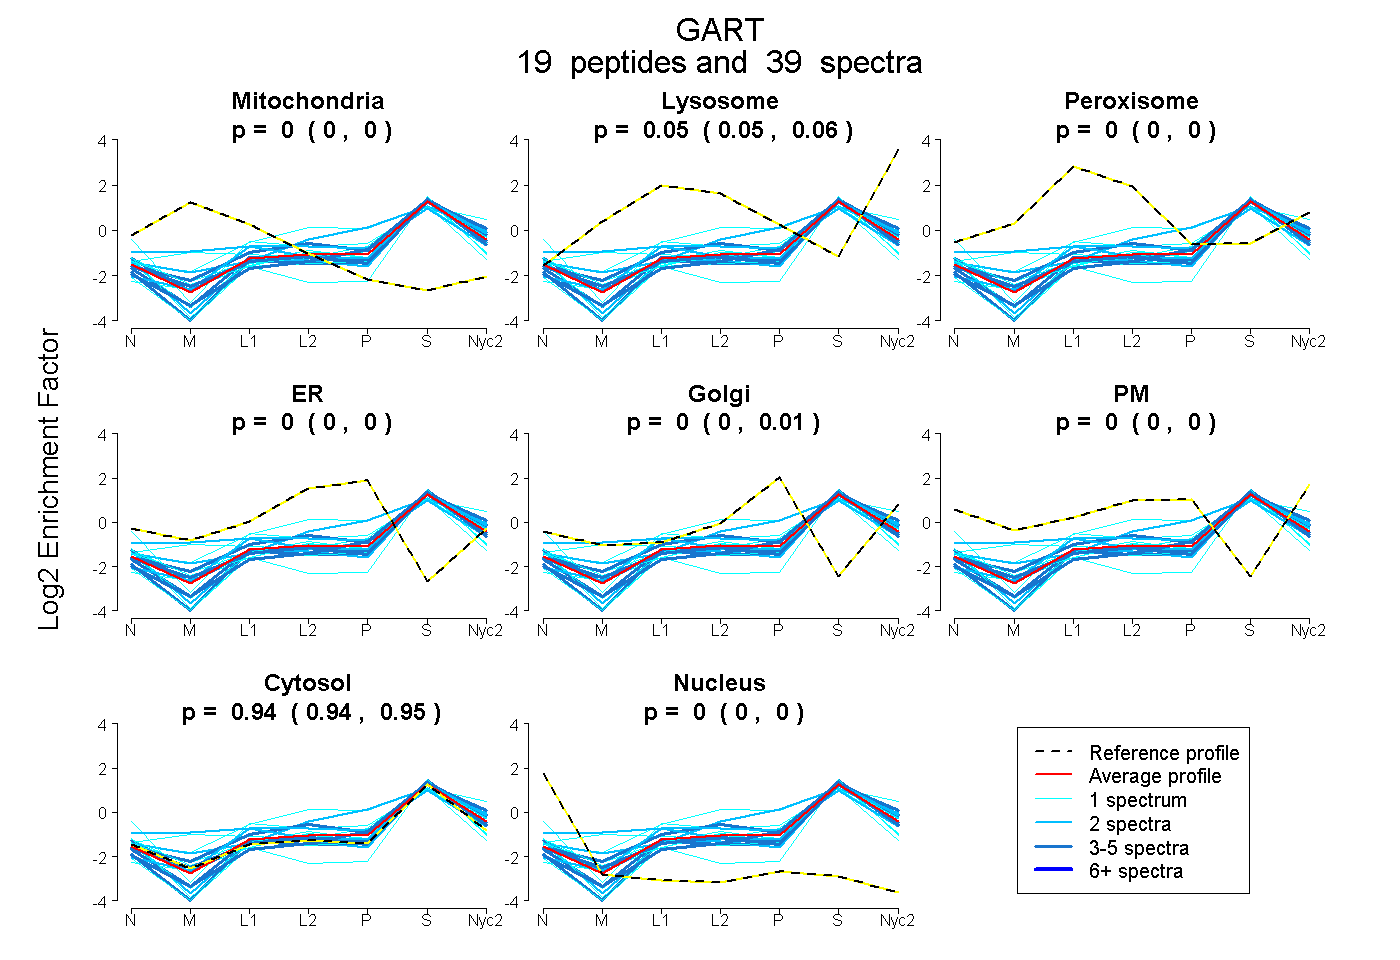
0.000 | 0.000
0.047 | 0.058
0.000 | 0.000
0.000 | 0.000
0.000 | 0.007
0.000 | 0.000
0.939 | 0.949
0.000 | 0.000
8peptides
spectra
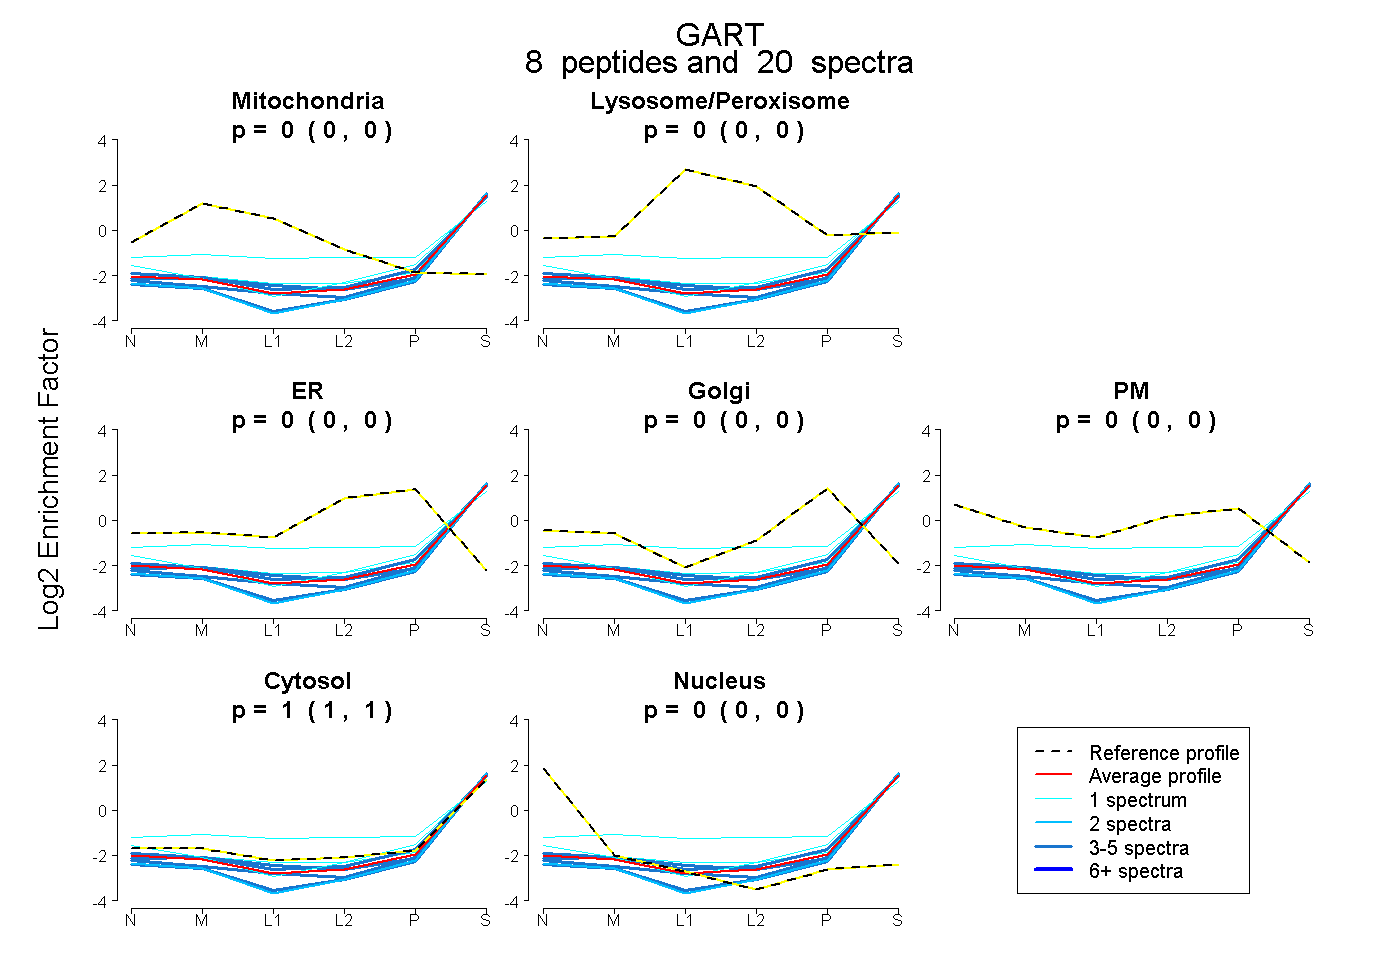
0.000 | 0.000
0.000 | 0.000
0.000 | 0.000
0.000 | 0.000
0.000 | 0.000
1.000 | 1.000
0.000 | 0.000