 19
19peptides
spectra
0.000 | 0.000
0.047 | 0.058
0.000 | 0.000
0.000 | 0.000
0.000 | 0.007
0.000 | 0.000
0.939 | 0.949
0.000 | 0.000
| Plot | Mito | Lyso | Perox | ER | Golgi | PM | Cytosol | Nucleus | |||||
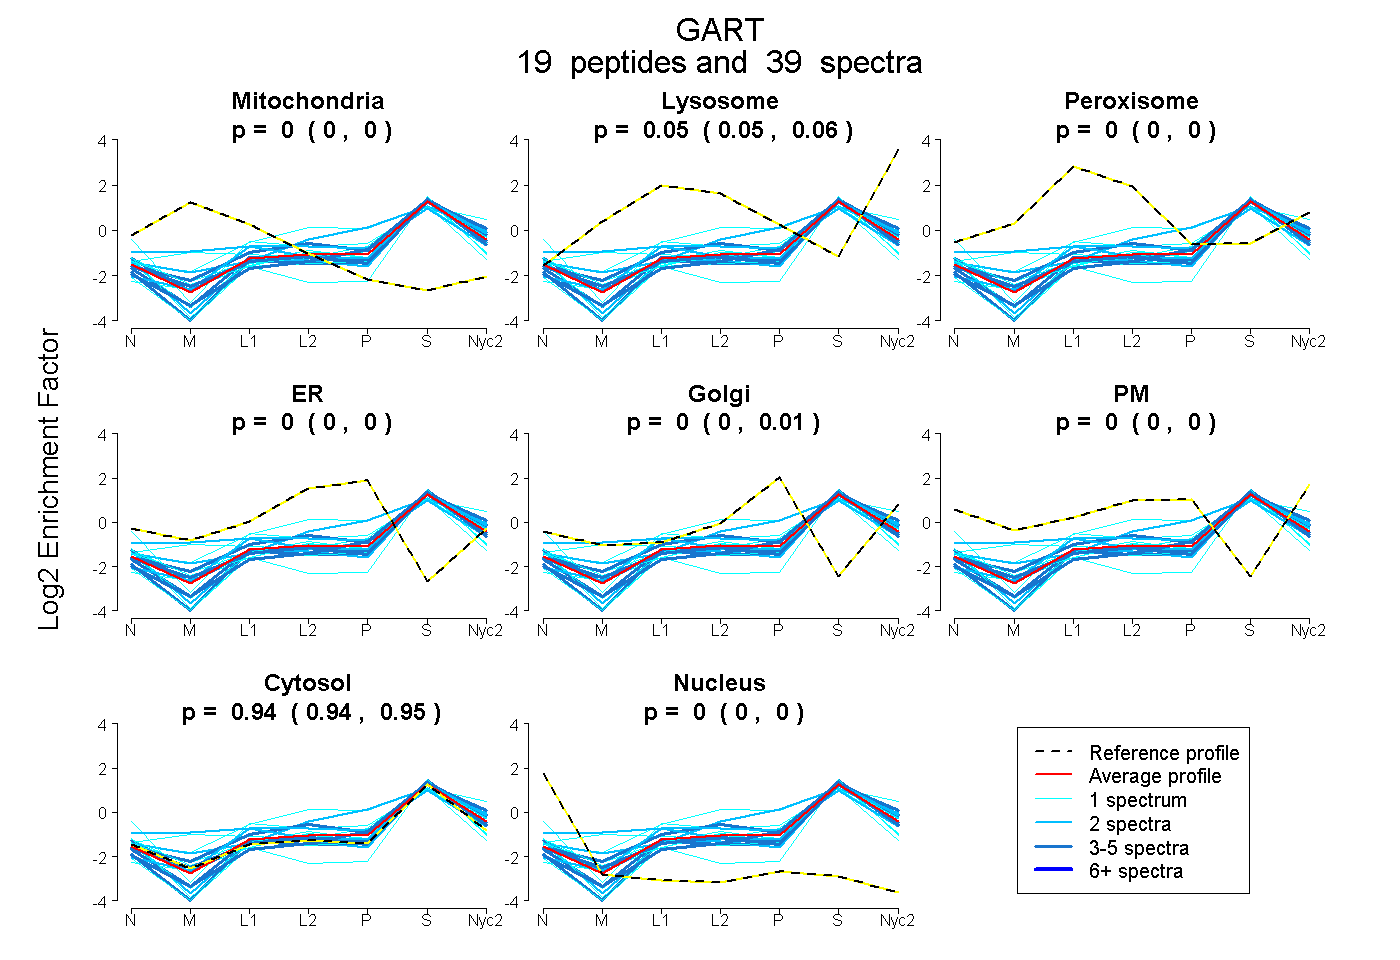
| Expt A |
19 peptides |
39 spectra |
|
0.000 0.000 | 0.000 |
0.054 0.047 | 0.058 |
0.000 0.000 | 0.000 |
0.000 0.000 | 0.000 |
0.001 0.000 | 0.007 |
0.000 0.000 | 0.000 |
0.945 0.939 | 0.949 |
0.000 0.000 | 0.000 |
| 4 spectra, ILSGPFVR | 0.000 | 0.168 | 0.000 | 0.000 | 0.000 | 0.000 | 0.832 | 0.000 | ||
| 1 spectrum, GVEITGFPEAQALGLQVFHAGTALK | 0.000 | 0.000 | 0.000 | 0.000 | 0.000 | 0.000 | 0.973 | 0.027 | ||
| 1 spectrum, AEACEAVQEIMQEK | 0.176 | 0.000 | 0.045 | 0.000 | 0.000 | 0.000 | 0.779 | 0.000 | ||
| 1 spectrum, IAQLCNK | 0.000 | 0.085 | 0.000 | 0.000 | 0.000 | 0.000 | 0.915 | 0.000 | ||
| 1 spectrum, GLAALK | 0.000 | 0.000 | 0.000 | 0.000 | 0.041 | 0.000 | 0.959 | 0.000 | ||
| 4 spectra, AVAFLQRPR | 0.000 | 0.000 | 0.000 | 0.000 | 0.000 | 0.000 | 1.000 | 0.000 | ||
| 2 spectra, FEGAVYR | 0.000 | 0.087 | 0.000 | 0.000 | 0.196 | 0.000 | 0.717 | 0.000 | ||
| 1 spectrum, AFAHITGGGLLENIPR | 0.000 | 0.262 | 0.000 | 0.088 | 0.000 | 0.000 | 0.650 | 0.000 | ||
| 2 spectra, AAVAGLDR | 0.000 | 0.000 | 0.000 | 0.000 | 0.000 | 0.000 | 1.000 | 0.000 | ||
| 1 spectrum, FGDPECQVILPLLK | 0.000 | 0.000 | 0.000 | 0.000 | 0.000 | 0.000 | 0.960 | 0.040 | ||
| 1 spectrum, ATSRPGCSVDLGGFAGLFDLK | 0.000 | 0.000 | 0.000 | 0.000 | 0.000 | 0.000 | 1.000 | 0.000 | ||
| 4 spectra, DDTVATLSER | 0.000 | 0.061 | 0.000 | 0.000 | 0.000 | 0.000 | 0.939 | 0.000 | ||
| 2 spectra, IYSHSLLPIIR | 0.000 | 0.100 | 0.000 | 0.000 | 0.000 | 0.000 | 0.900 | 0.000 | ||
| 4 spectra, ENLMSALDEAR | 0.000 | 0.026 | 0.000 | 0.000 | 0.000 | 0.000 | 0.974 | 0.000 | ||
| 3 spectra, VLVIGSGGR | 0.000 | 0.040 | 0.000 | 0.000 | 0.000 | 0.000 | 0.960 | 0.000 | ||
| 3 spectra, VLTVTAVR | 0.000 | 0.000 | 0.000 | 0.000 | 0.000 | 0.000 | 1.000 | 0.000 | ||
| 1 spectrum, TVAPMPPAQDHK | 0.000 | 0.015 | 0.000 | 0.000 | 0.035 | 0.024 | 0.926 | 0.000 | ||
| 2 spectra, VLEFNCR | 0.093 | 0.000 | 0.179 | 0.000 | 0.041 | 0.000 | 0.687 | 0.000 | ||
| 1 spectrum, GSVVTNGFLR | 0.000 | 0.000 | 0.054 | 0.092 | 0.000 | 0.027 | 0.828 | 0.000 |
| Plot | Mito | Lyso or Perox | ER | Golgi | PM | Cytosol | Nucleus | ||||||
| Expt B |
8 peptides |
20 spectra |
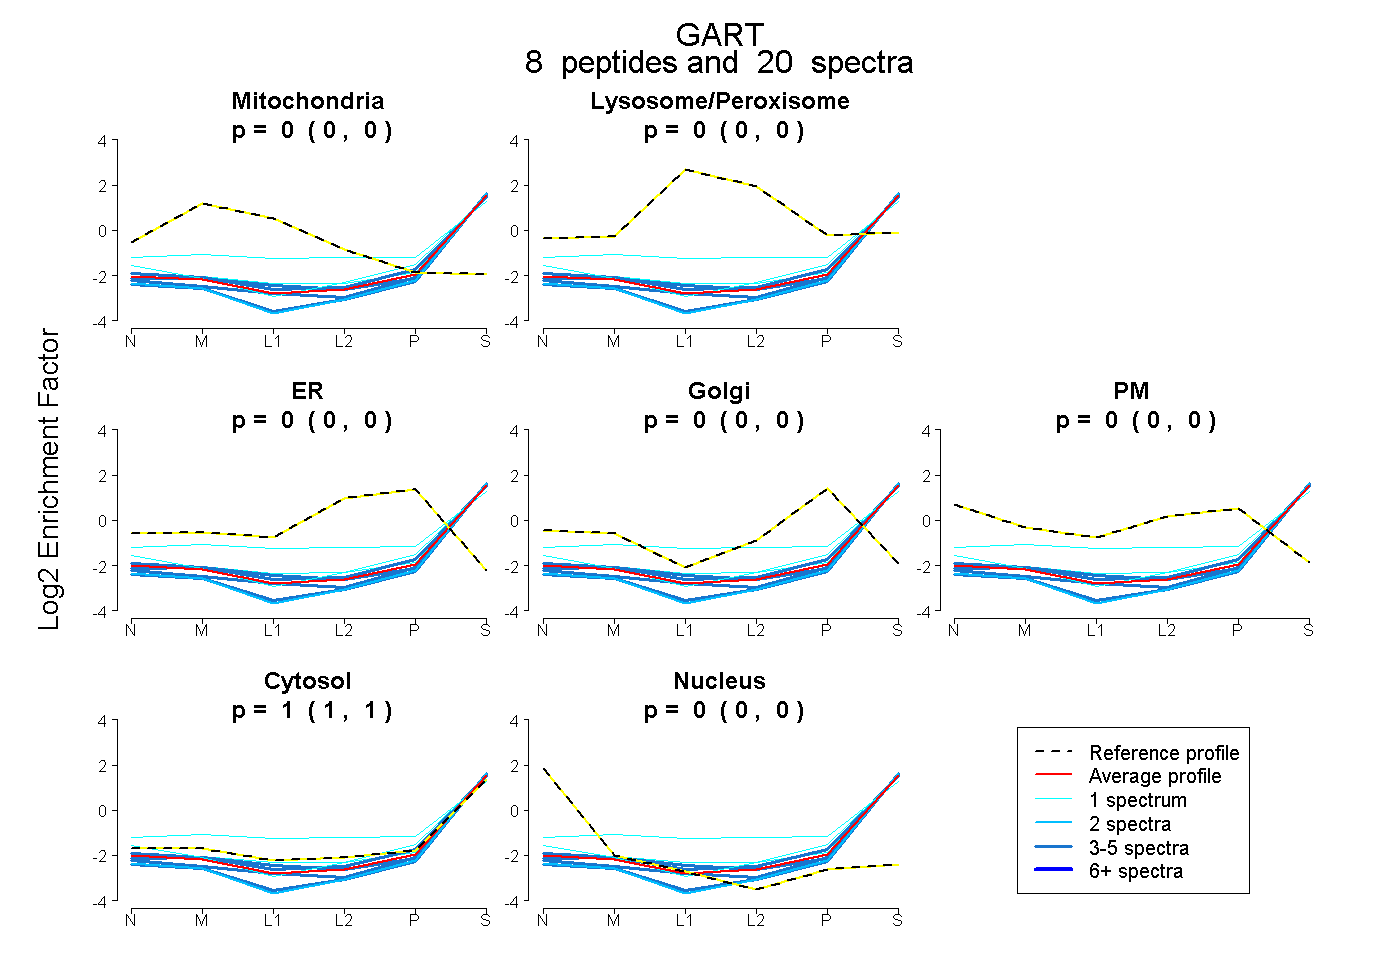 |
0.000 0.000 | 0.000 |
0.000 0.000 | 0.000 |
0.000 0.000 | 0.000 |
0.000 0.000 | 0.000 |
0.000 0.000 | 0.000 |
1.000 1.000 | 1.000 |
0.000 0.000 | 0.000 |
|||
| Plot | Lyso | Other | |||||||||||
| Expt C |
16 peptides |
33 spectra |
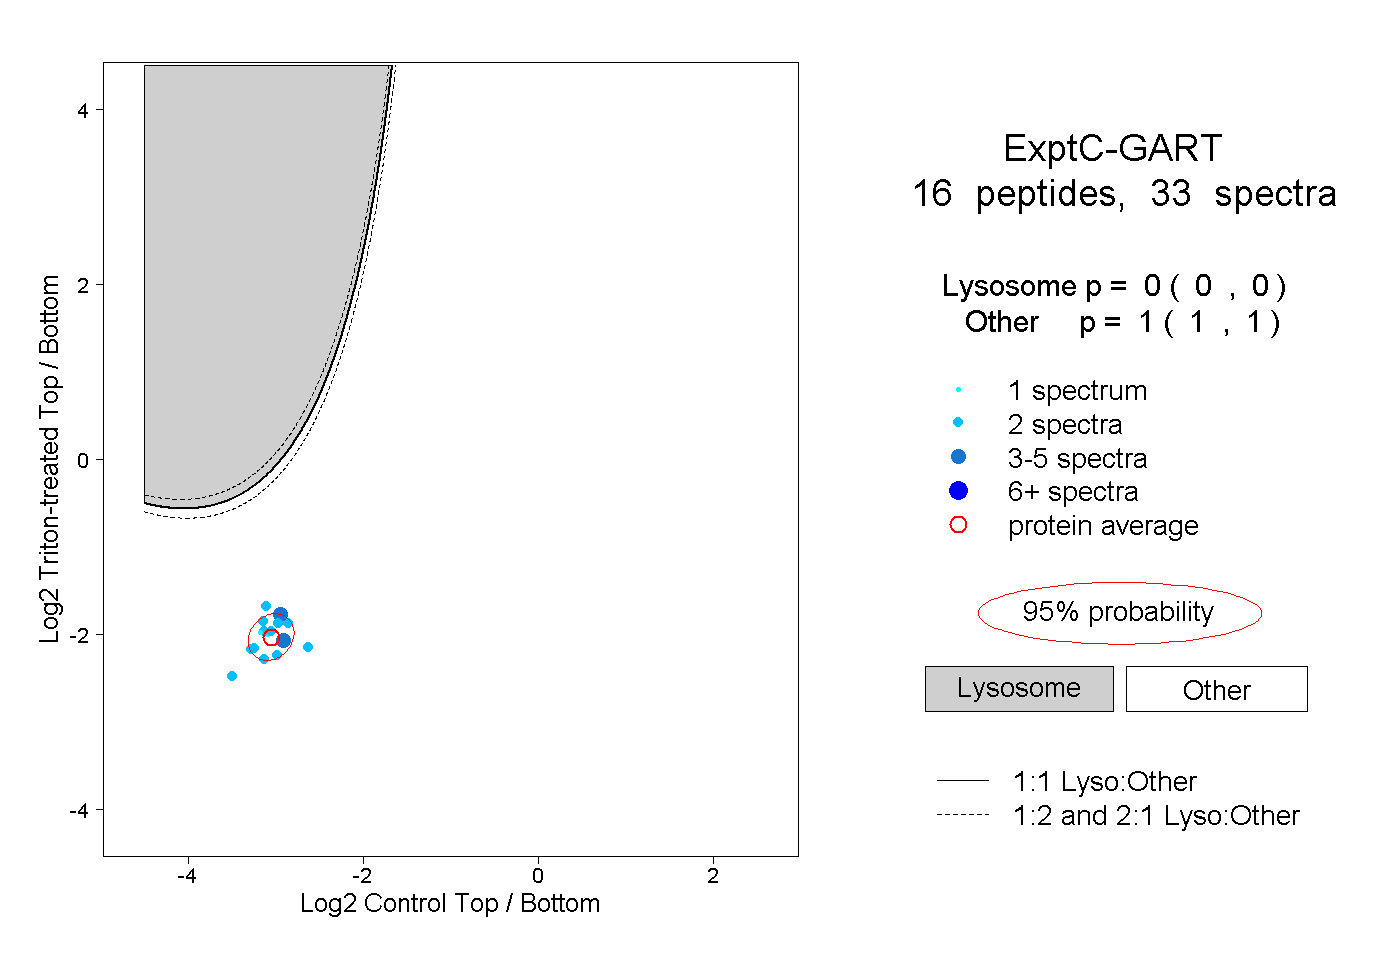 |
0.000 0.000 | 0.000 |
1.000 1.000 | 1.000 |
||||||||
| Plot | Lyso | Other | |||||||||||
| Expt D |
1 peptide |
2 spectra |
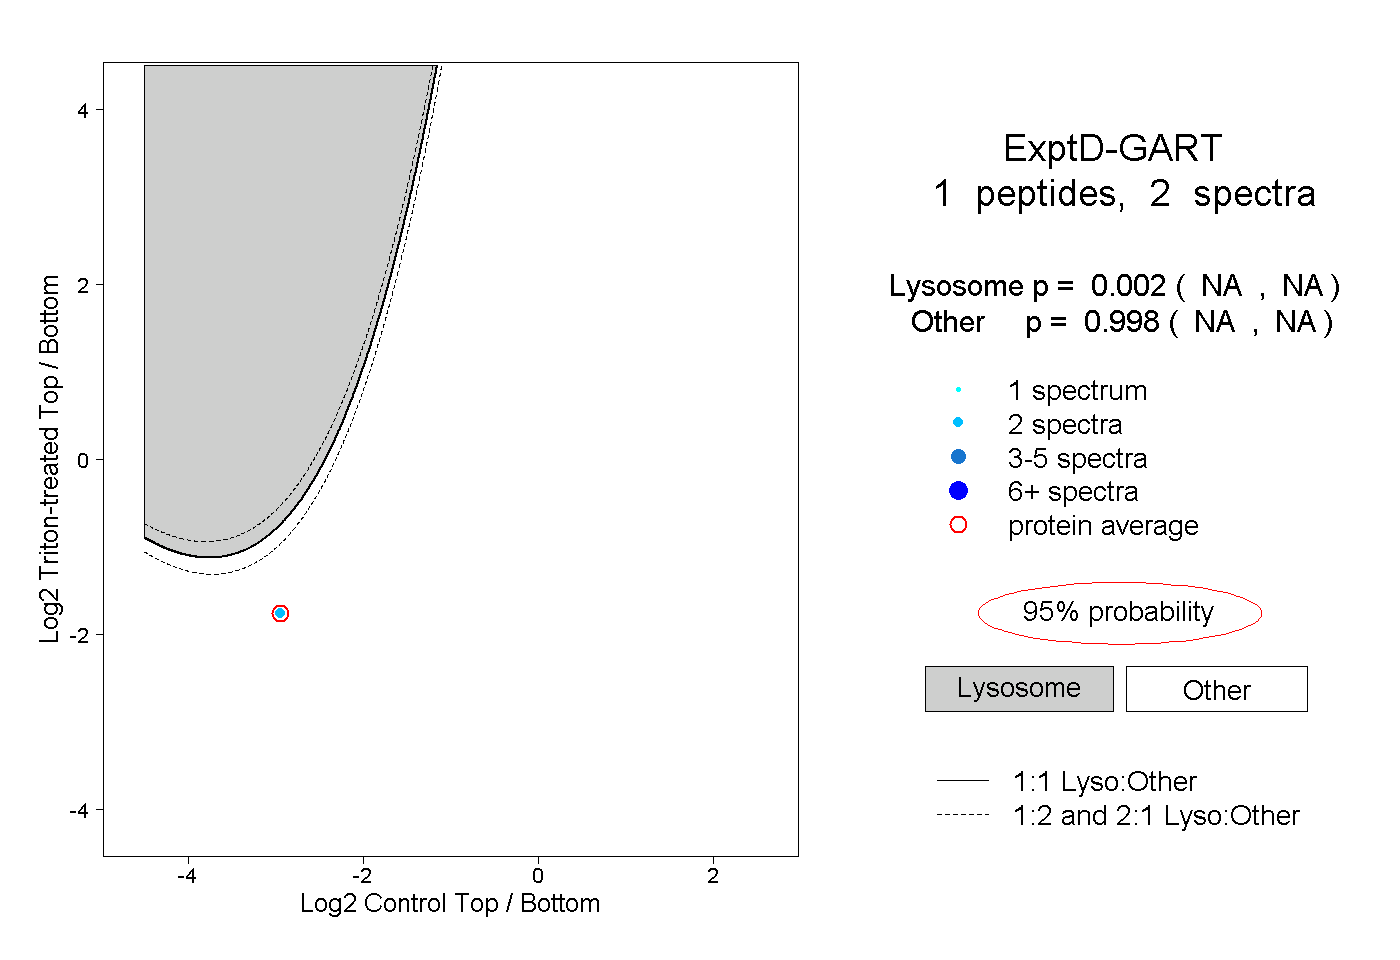 |
0.002 NA | NA |
0.998 NA | NA |