 2
2peptides
spectra
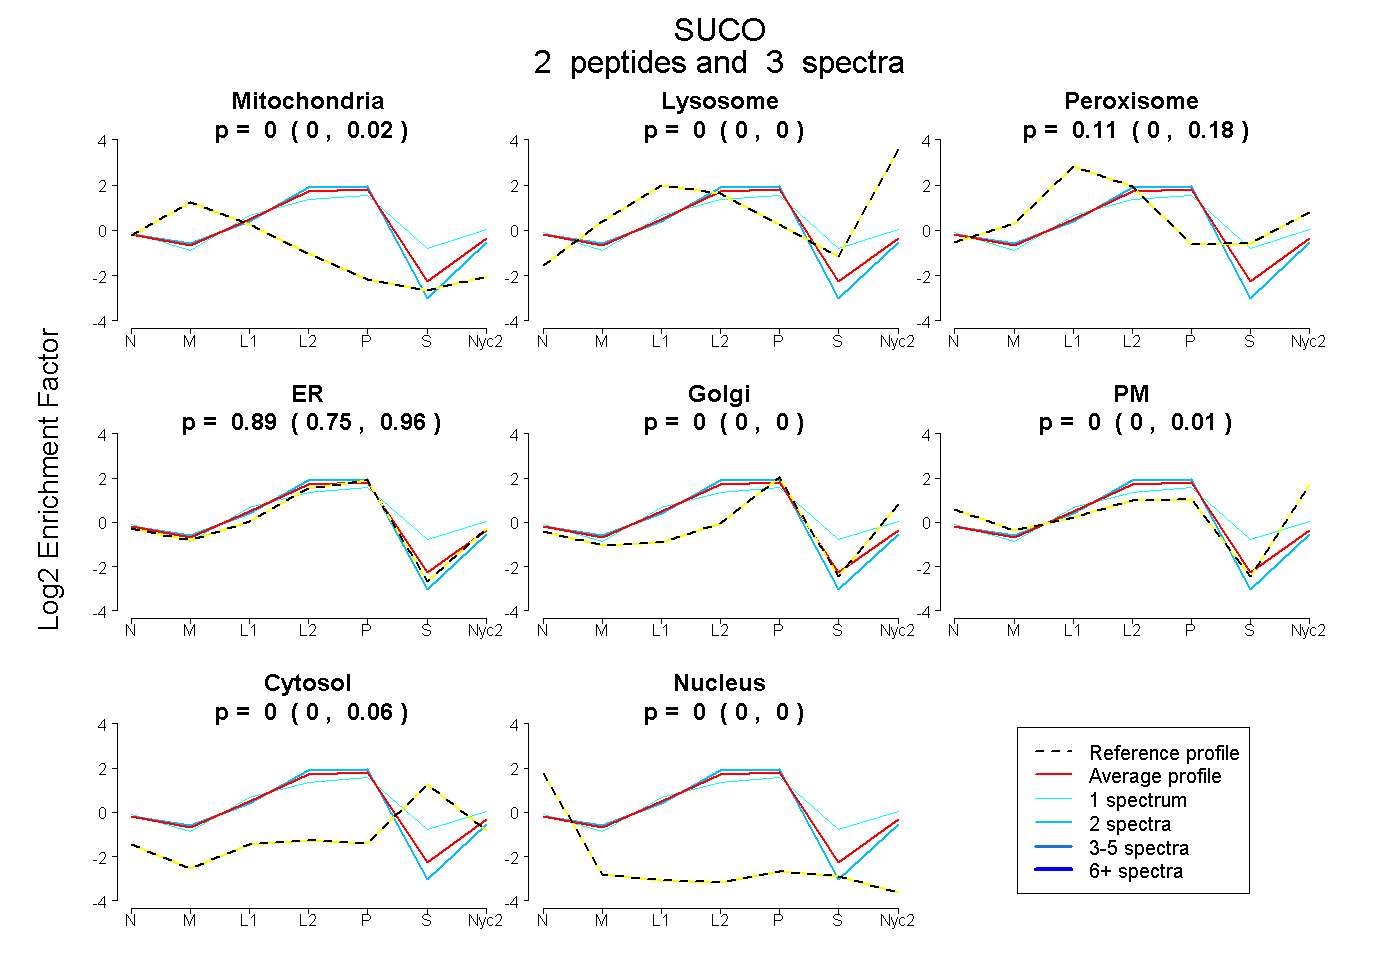
0.000 | 0.016
0.000 | 0.000
0.002 | 0.177
0.748 | 0.963
0.000 | 0.000
0.000 | 0.012
0.000 | 0.058
0.000 | 0.000
| Plot | Mito | Lyso | Perox | ER | Golgi | PM | Cytosol | Nucleus | |||||
| Expt A |
2 peptides |
3 spectra |
|
0.000 0.000 | 0.016 |
0.000 0.000 | 0.000 |
0.112 0.002 | 0.177 |
0.888 0.748 | 0.963 |
0.000 0.000 | 0.000 |
0.000 0.000 | 0.012 |
0.000 0.000 | 0.058 |
0.000 0.000 | 0.000 |
| 2 spectra, LGTFHGR | 0.000 | 0.000 | 0.010 | 0.990 | 0.000 | 0.000 | 0.000 | 0.000 | ||
| 1 spectrum, IAEEQDQR | 0.000 | 0.000 | 0.265 | 0.566 | 0.041 | 0.000 | 0.127 | 0.000 |