 5
5peptides
spectra
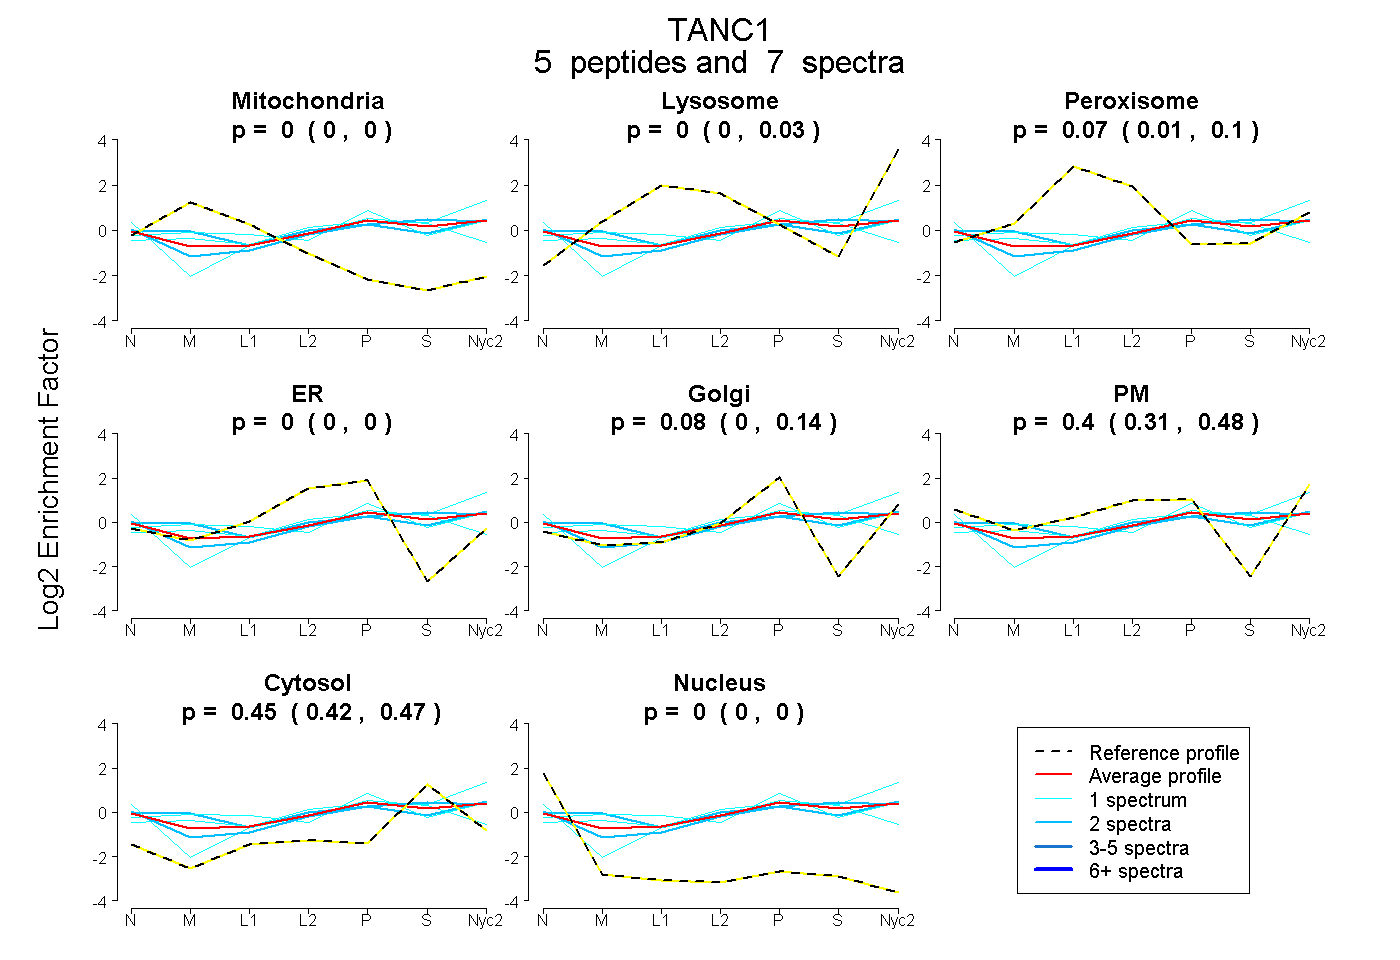
0.000 | 0.000
0.000 | 0.033
0.007 | 0.104
0.000 | 0.000
0.004 | 0.142
0.309 | 0.480
0.423 | 0.475
0.000 | 0.000
| Plot | Mito | Lyso | Perox | ER | Golgi | PM | Cytosol | Nucleus | |||||
| Expt A |
5 peptides |
7 spectra |
|
0.000 0.000 | 0.000 |
0.000 0.000 | 0.033 |
0.066 0.007 | 0.104 |
0.000 0.000 | 0.000 |
0.080 0.004 | 0.142 |
0.403 0.309 | 0.480 |
0.451 0.423 | 0.475 |
0.000 0.000 | 0.000 |
| 1 spectrum, LGPSQSLQLQR | 0.045 | 0.039 | 0.205 | 0.000 | 0.447 | 0.006 | 0.258 | 0.000 | ||
| 2 spectra, EGLGEDMRPFNELR | 0.064 | 0.032 | 0.037 | 0.000 | 0.000 | 0.483 | 0.384 | 0.000 | ||
| 2 spectra, LTLDLFQR | 0.000 | 0.000 | 0.000 | 0.000 | 0.000 | 0.453 | 0.547 | 0.000 | ||
| 1 spectrum, GQCALVHSALR | 0.000 | 0.262 | 0.000 | 0.000 | 0.055 | 0.267 | 0.417 | 0.000 | ||
| 1 spectrum, GVPPLFCAAR | 0.000 | 0.000 | 0.000 | 0.273 | 0.000 | 0.153 | 0.558 | 0.016 |
| Plot | Lyso | Other | |||||||||||
| Expt C |
8 peptides |
12 spectra |
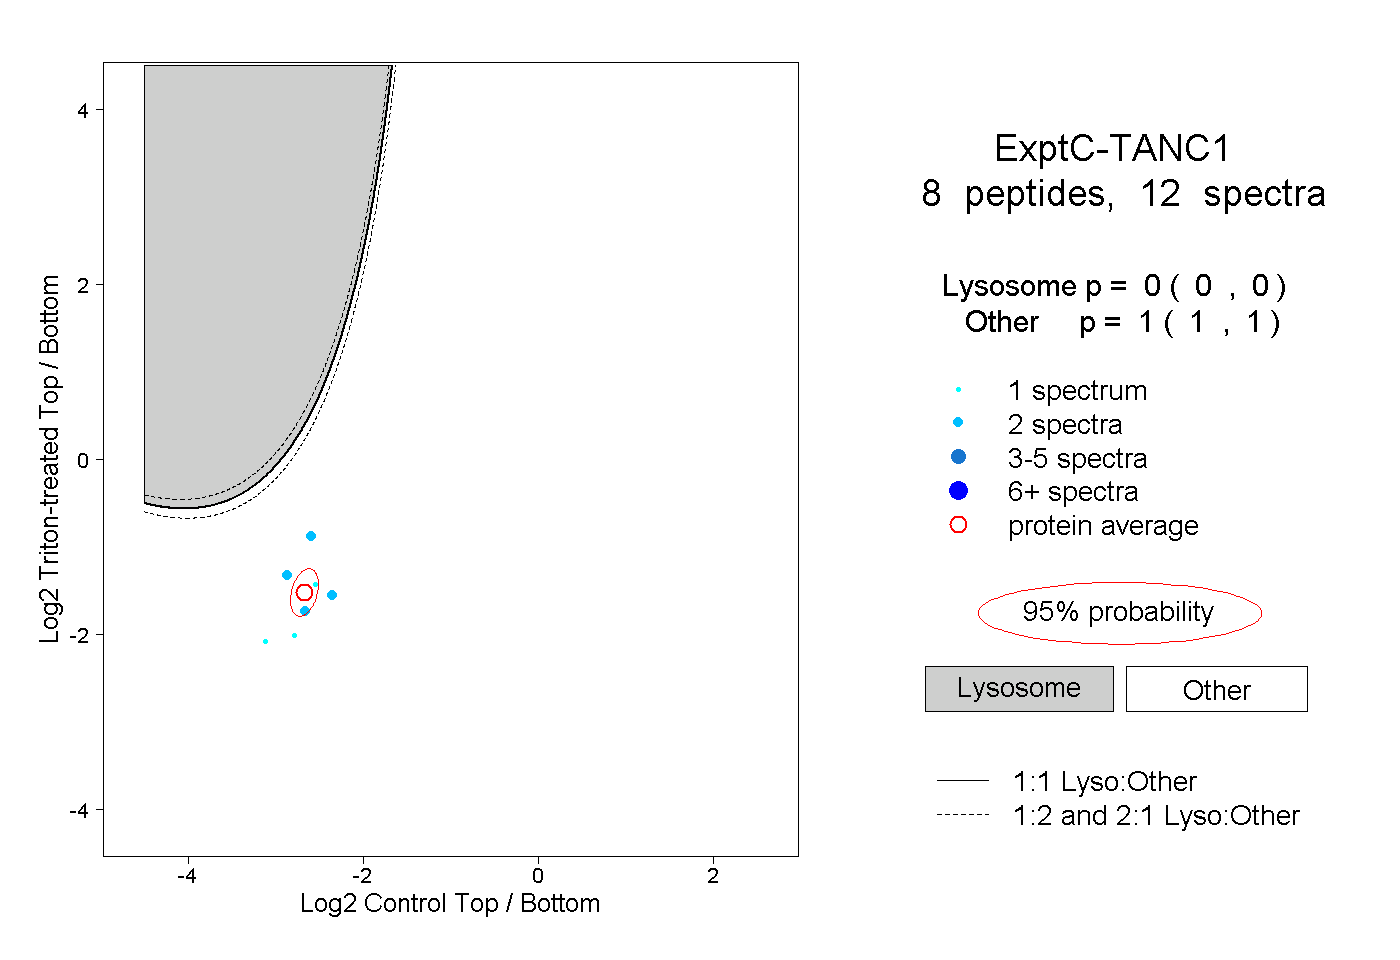 |
0.000 0.000 | 0.000 |
1.000 1.000 | 1.000 |