 4
4peptides
spectra
0.000 | 0.019
0.000 | 0.000
0.000 | 0.017
0.000 | 0.131
0.000 | 0.168
0.000 | 0.069
0.787 | 0.888
0.000 | 0.105
1peptide
spectrum
NA | NA
NA | NA
NA | NA
NA | NA
NA | NA
NA | NA
NA | NA
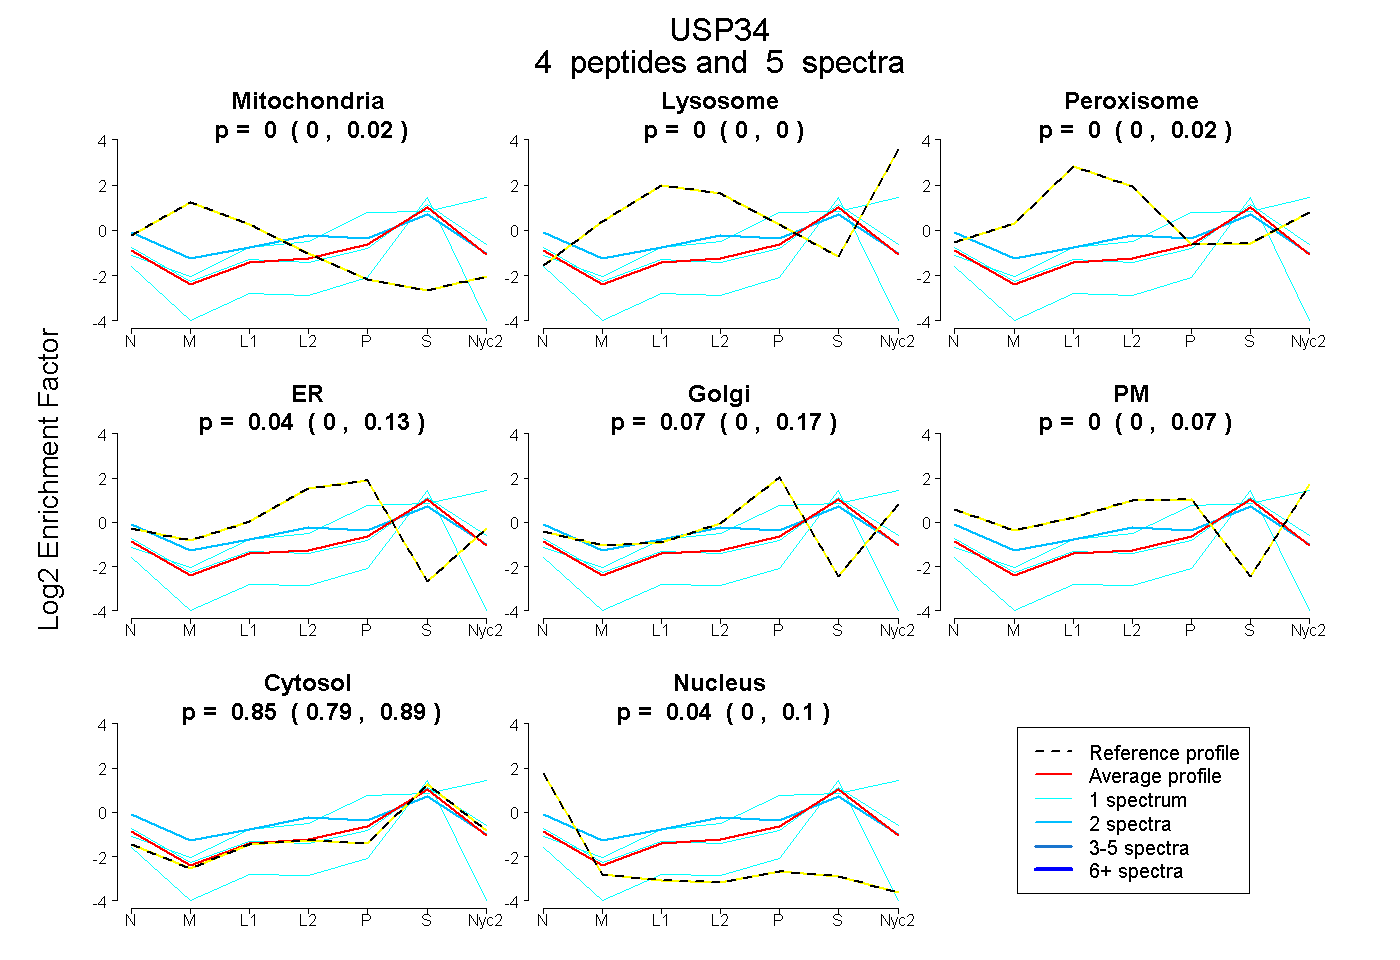
| Plot | Mito | Lyso | Perox | ER | Golgi | PM | Cytosol | Nucleus | |||||
| Expt A |
4 peptides |
5 spectra |
|
0.000 0.000 | 0.019 |
0.000 0.000 | 0.000 |
0.000 0.000 | 0.017 |
0.042 0.000 | 0.131 |
0.070 0.000 | 0.168 |
0.000 0.000 | 0.069 |
0.852 0.787 | 0.888 |
0.035 0.000 | 0.105 |
||
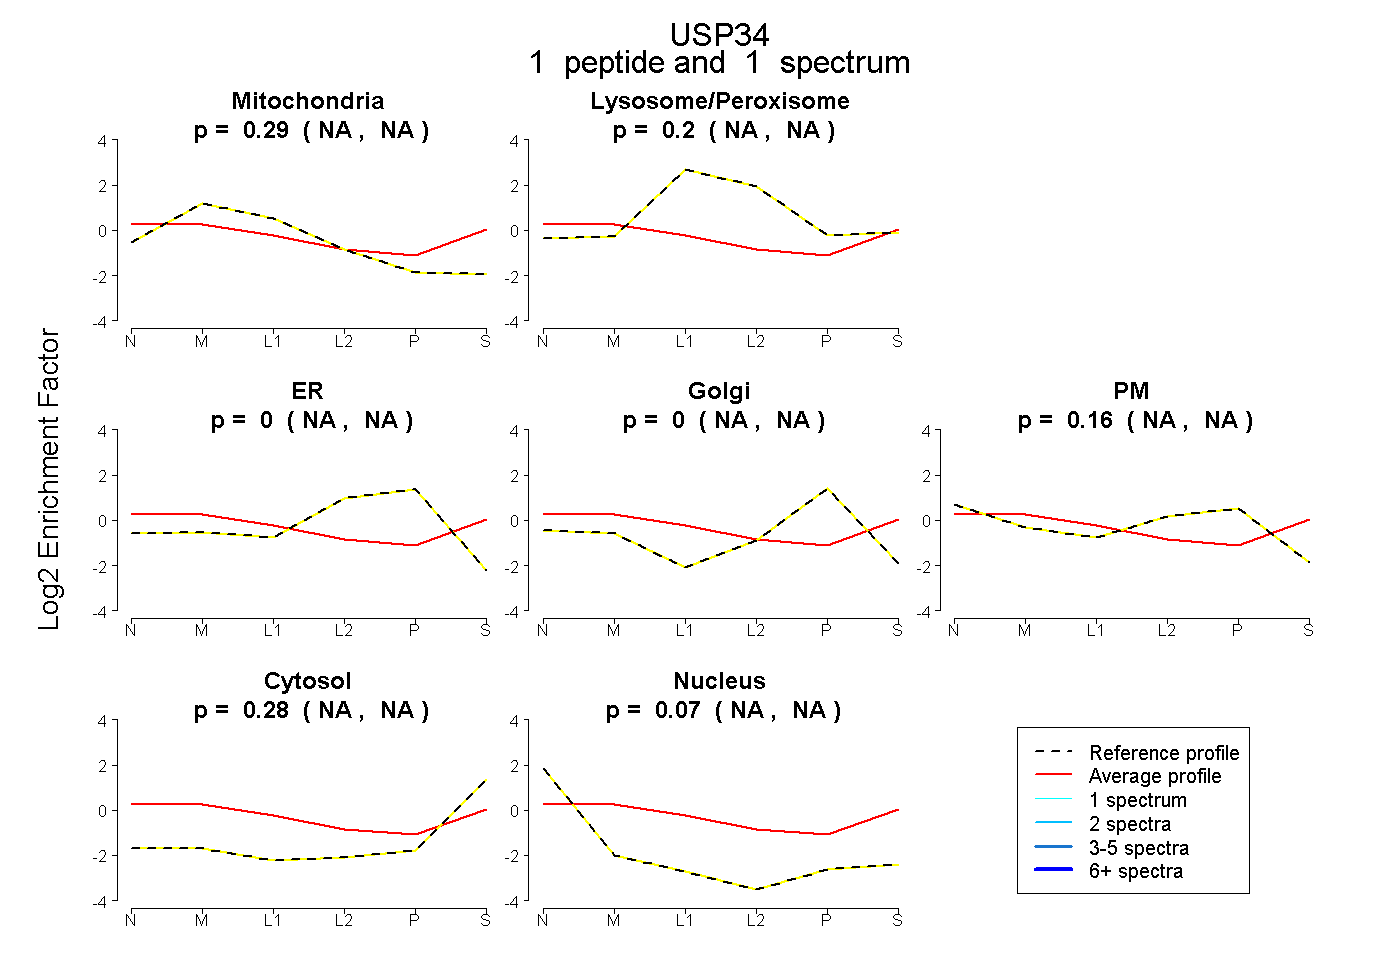
| Plot | Mito | Lyso or Perox | ER | Golgi | PM | Cytosol | Nucleus | ||||||
| Expt B |
1 peptide |
1 spectrum |
|
0.291 NA | NA |
0.203 NA | NA |
0.000 NA | NA |
0.000 NA | NA |
0.161 NA | NA |
0.275 NA | NA |
0.071 NA | NA |