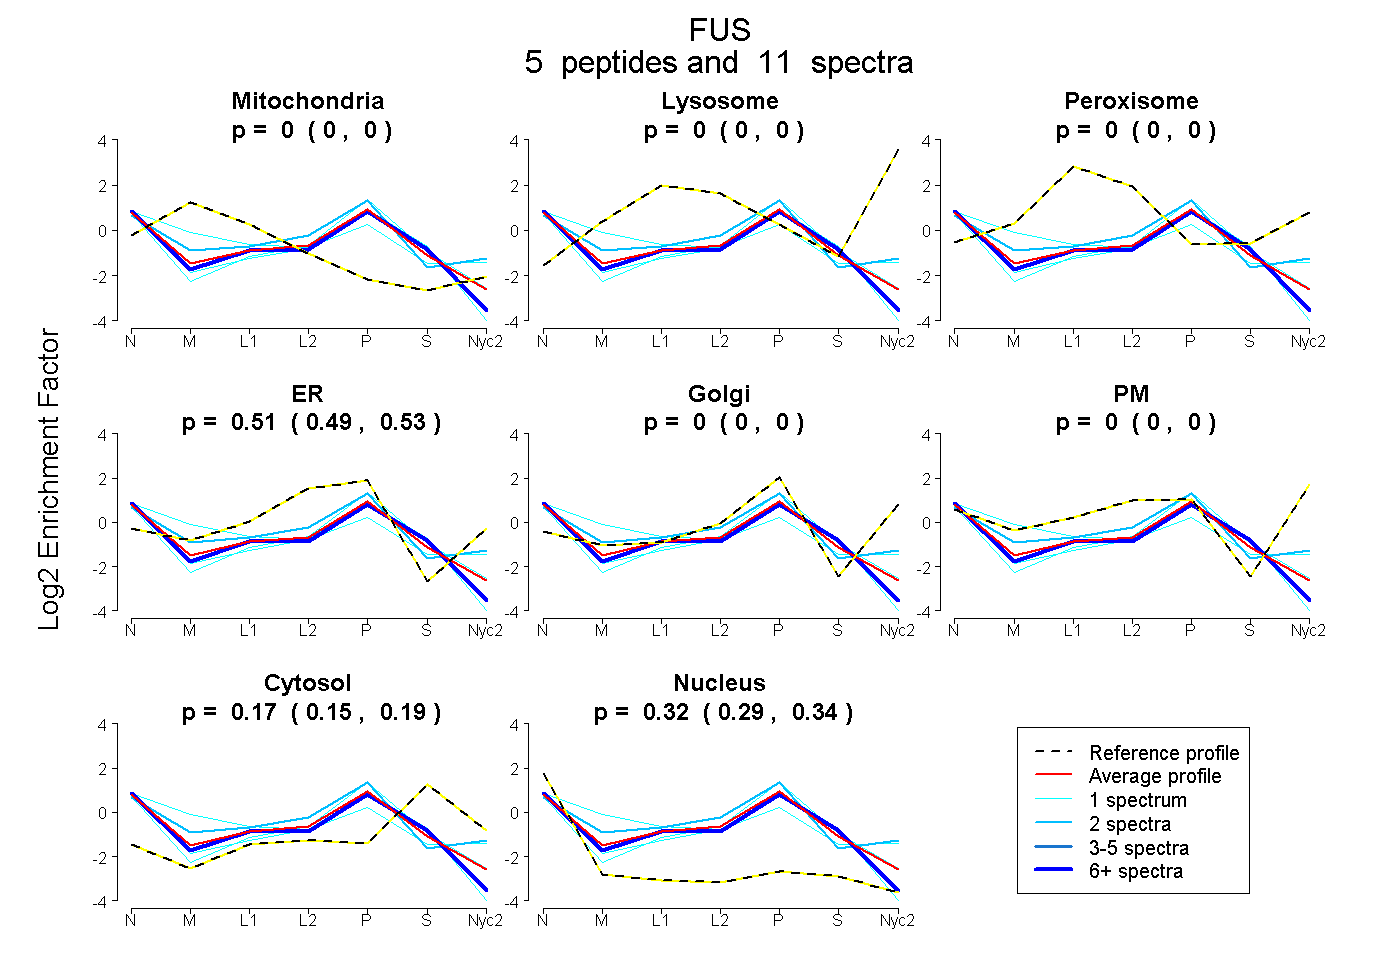
 5
5peptides
spectra
0.000 | 0.000
0.000 | 0.000
0.000 | 0.000
0.495 | 0.528
0.000 | 0.000
0.000 | 0.000
0.147 | 0.194
0.289 | 0.336
| Plot | Mito | Lyso | Perox | ER | Golgi | PM | Cytosol | Nucleus | |||||
| Expt A |
5 peptides |
11 spectra |
|
0.000 0.000 | 0.000 |
0.000 0.000 | 0.000 |
0.000 0.000 | 0.000 |
0.513 0.495 | 0.528 |
0.000 0.000 | 0.000 |
0.000 0.000 | 0.000 |
0.172 0.147 | 0.194 |
0.315 0.289 | 0.336 |
| 1 spectrum, EFSGNPIK | 0.000 | 0.000 | 0.000 | 0.403 | 0.000 | 0.000 | 0.186 | 0.411 | ||
| 6 spectra, TGQPMINLYTDR | 0.000 | 0.000 | 0.000 | 0.433 | 0.000 | 0.000 | 0.192 | 0.375 | ||
| 1 spectrum, GGFGPGK | 0.270 | 0.000 | 0.059 | 0.177 | 0.220 | 0.026 | 0.068 | 0.180 | ||
| 2 spectra, SECNQCK | 0.016 | 0.000 | 0.000 | 0.543 | 0.160 | 0.000 | 0.088 | 0.194 | ||
| 1 spectrum, CPNPTCENMNFSWR | 0.000 | 0.000 | 0.000 | 0.490 | 0.000 | 0.000 | 0.216 | 0.295 |
| Plot | Lyso | Other | |||||||||||
| Expt C |
2 peptides |
3 spectra |
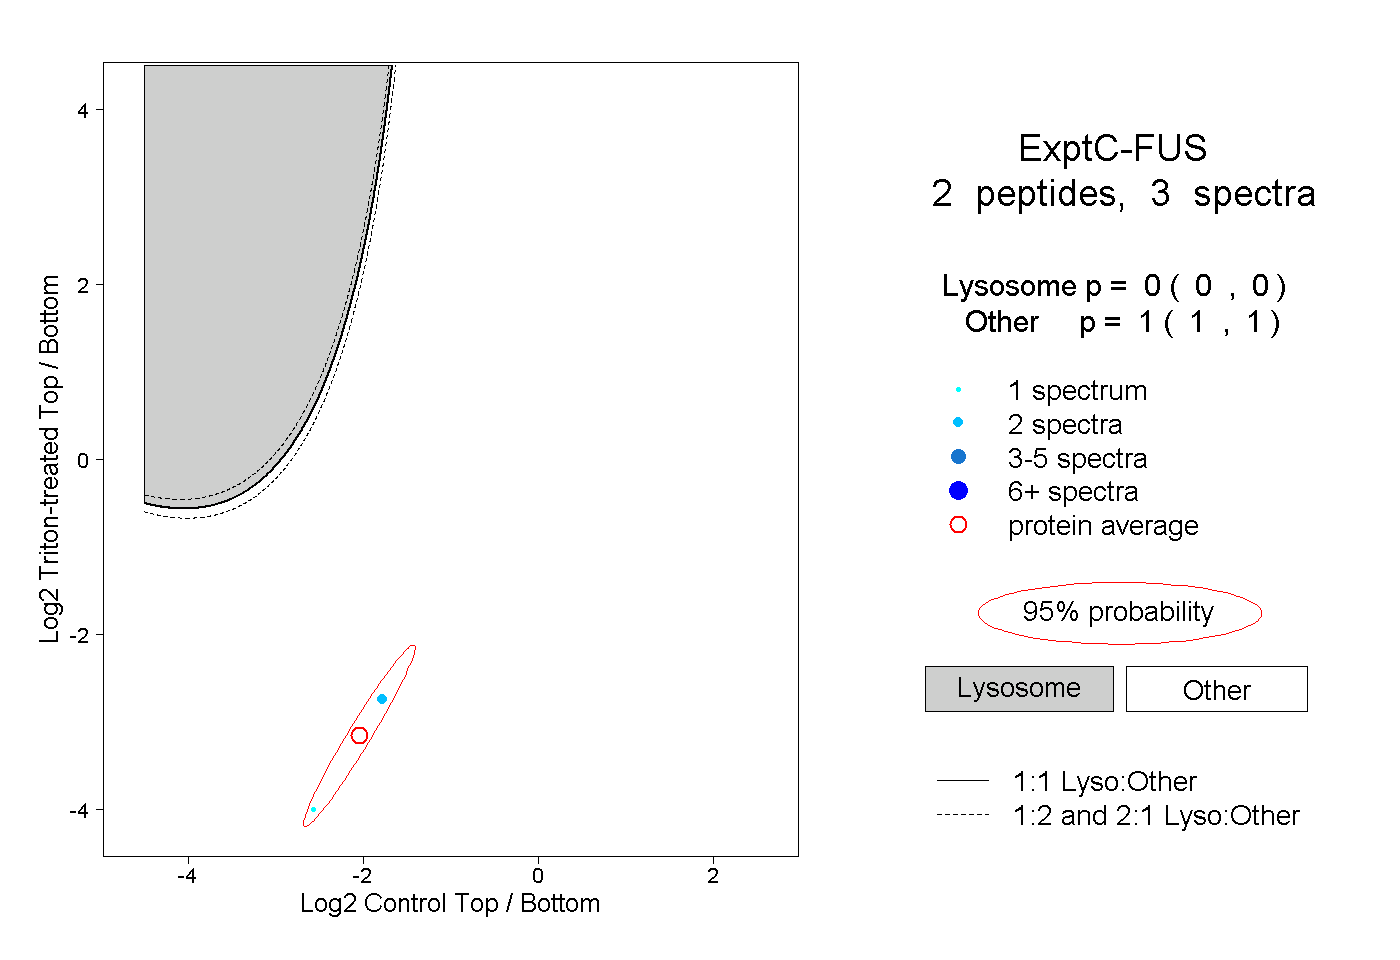 |
0.000 0.000 | 0.000 |
1.000 1.000 | 1.000 |