 9
9peptides
spectra
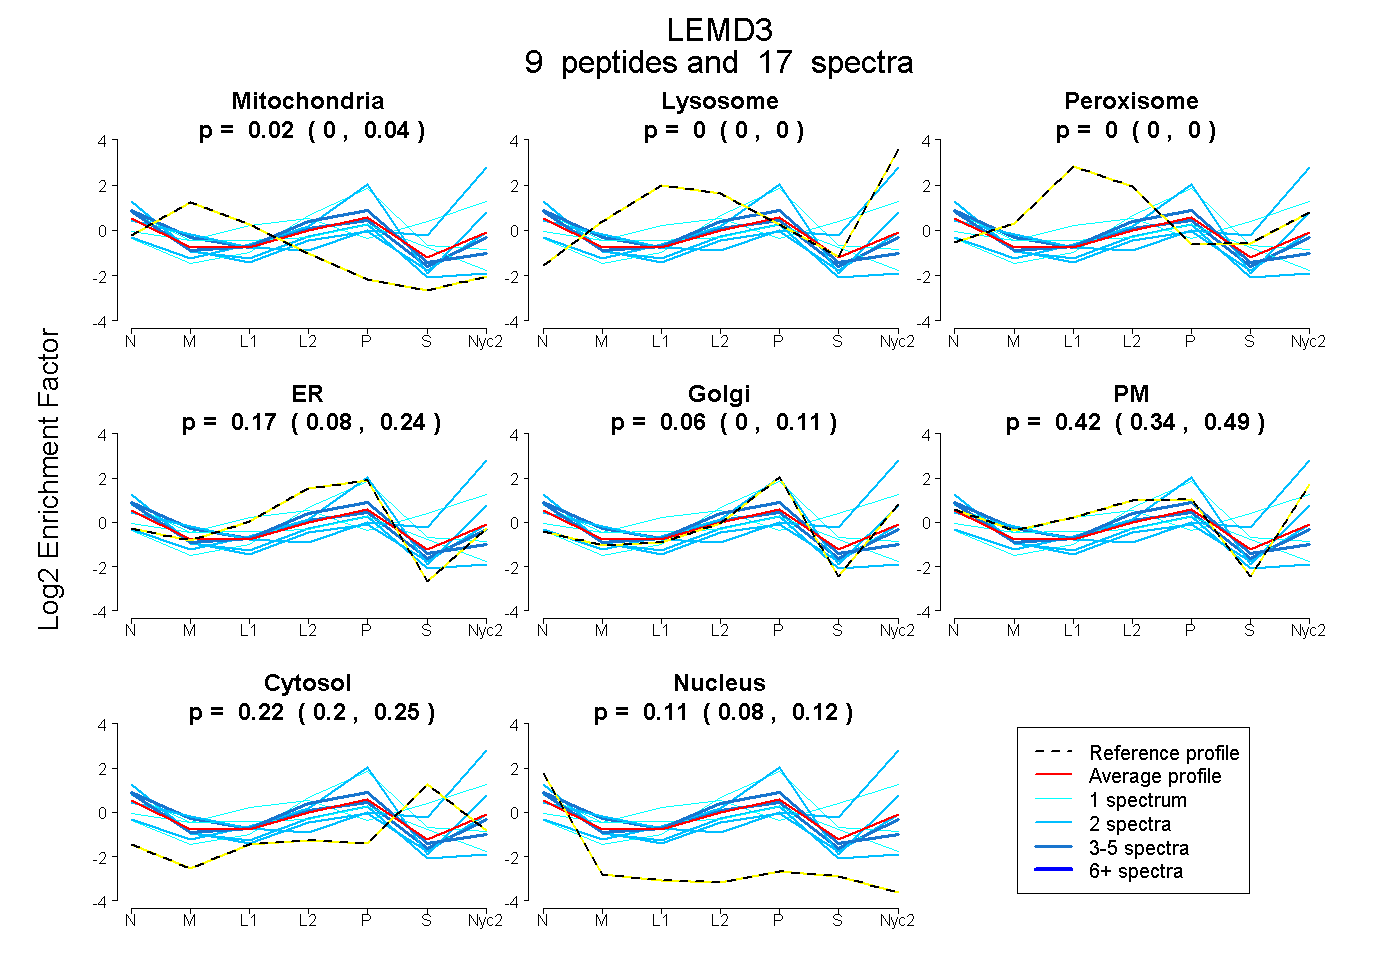
0.000 | 0.043
0.000 | 0.000
0.000 | 0.000
0.083 | 0.243
0.000 | 0.110
0.341 | 0.491
0.199 | 0.248
0.082 | 0.121
2peptides
spectra
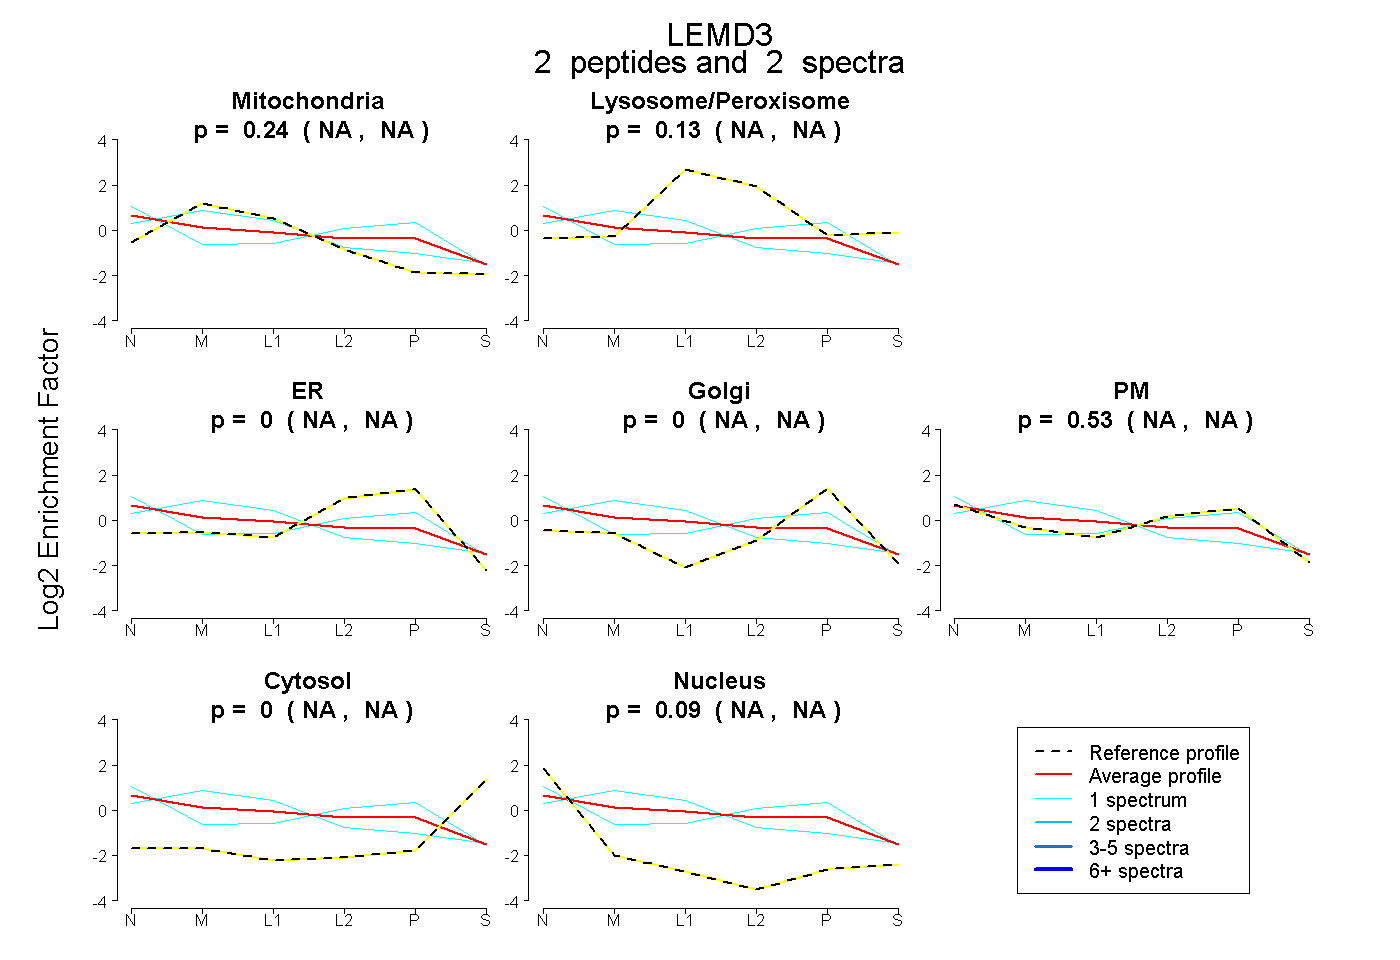
NA | NA
NA | NA
NA | NA
NA | NA
NA | NA
NA | NA
NA | NA
1peptide
spectrum
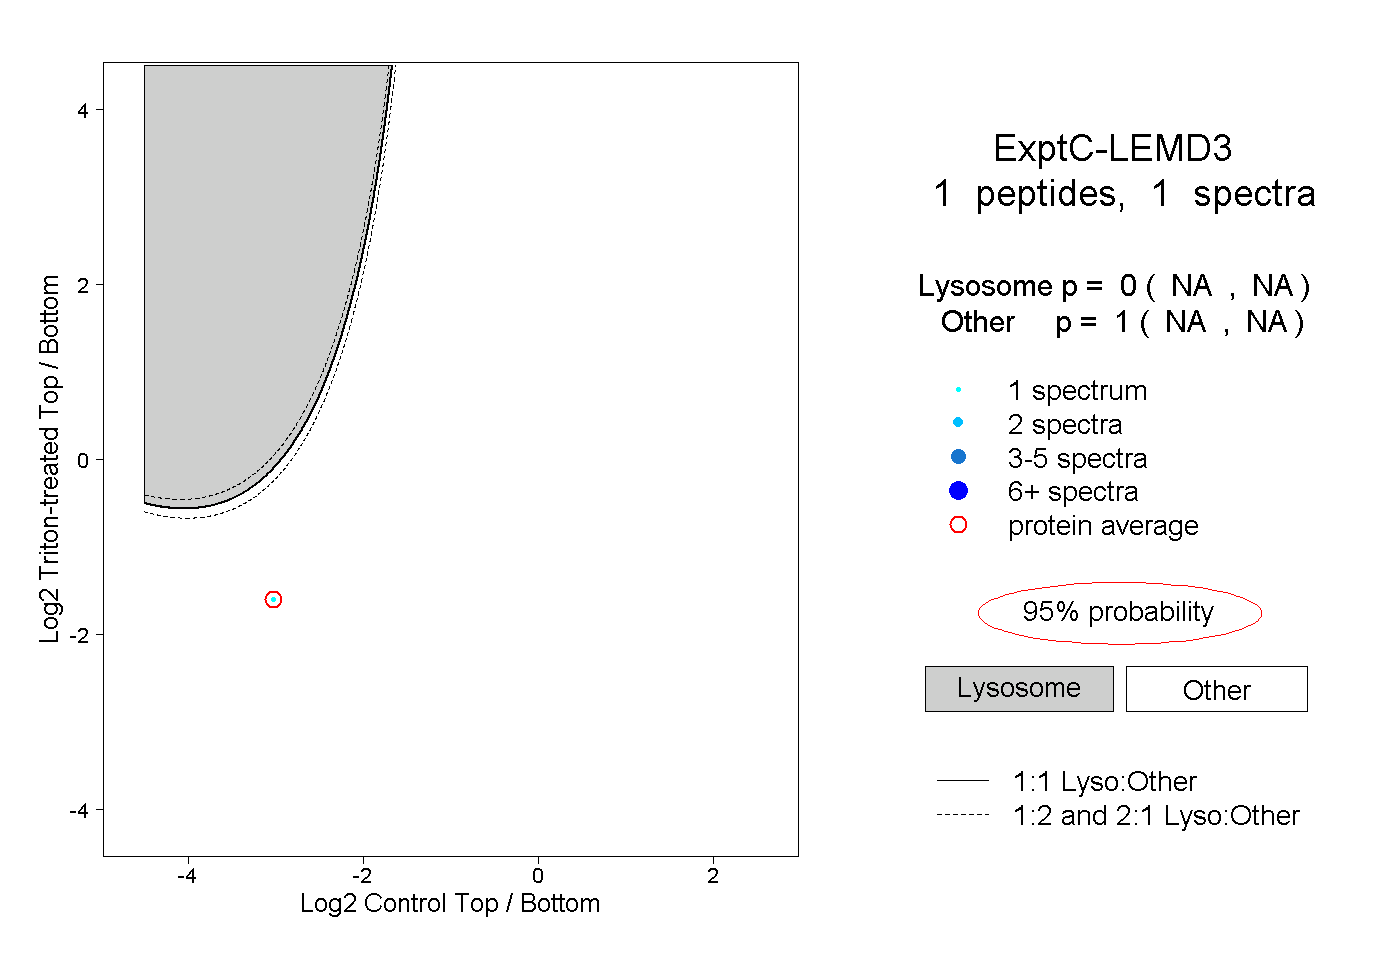
NA | NA
NA | NA