 17
17peptides
spectra
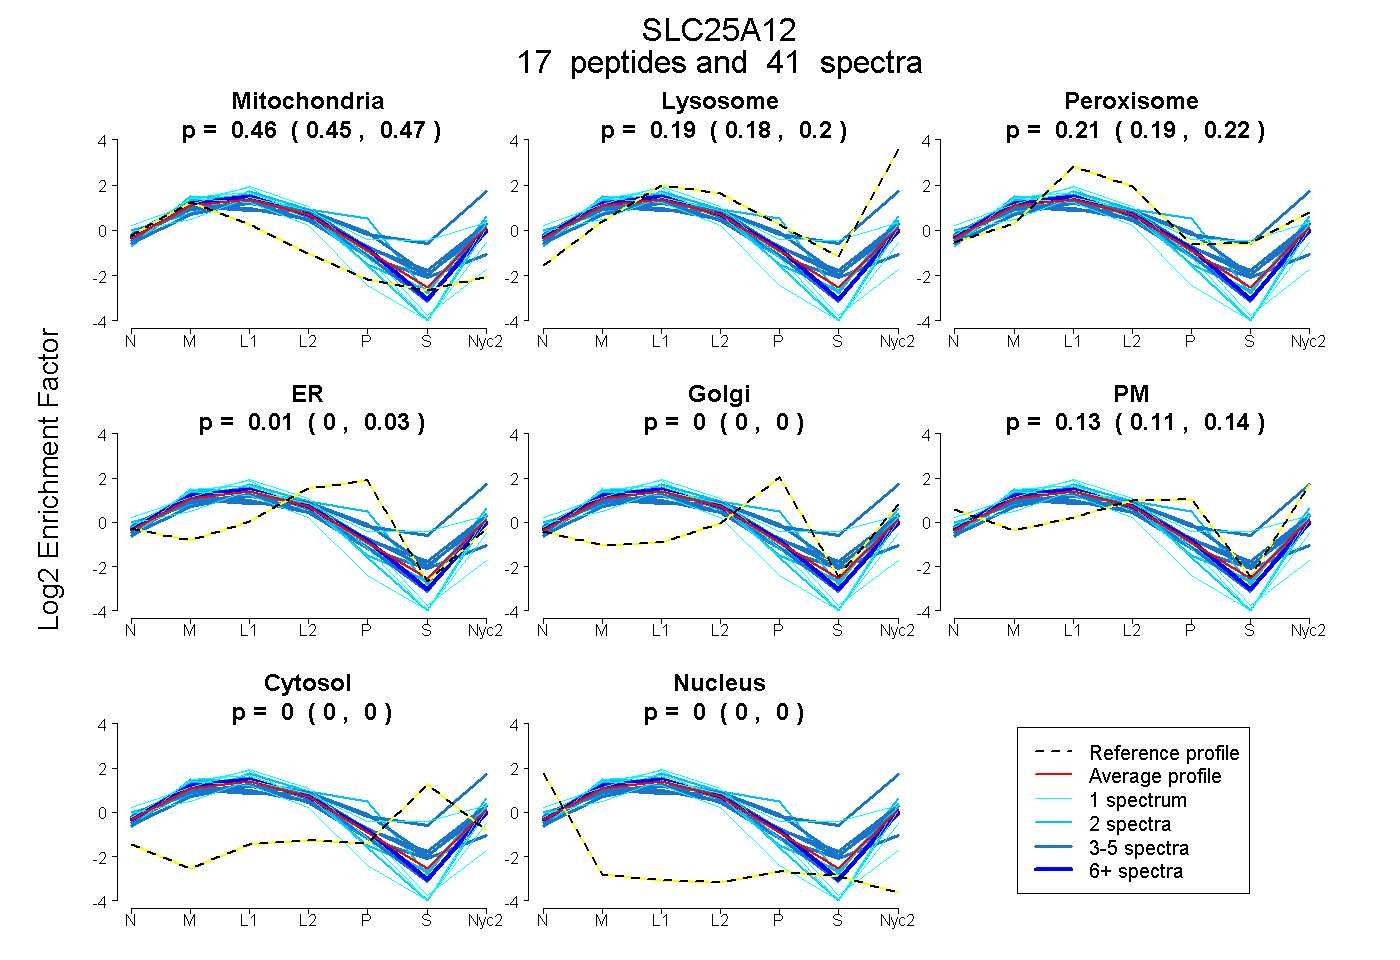
0.455 | 0.468
0.180 | 0.202
0.189 | 0.219
0.000 | 0.027
0.000 | 0.000
0.113 | 0.139
0.000 | 0.000
0.000 | 0.000
10peptides
spectra
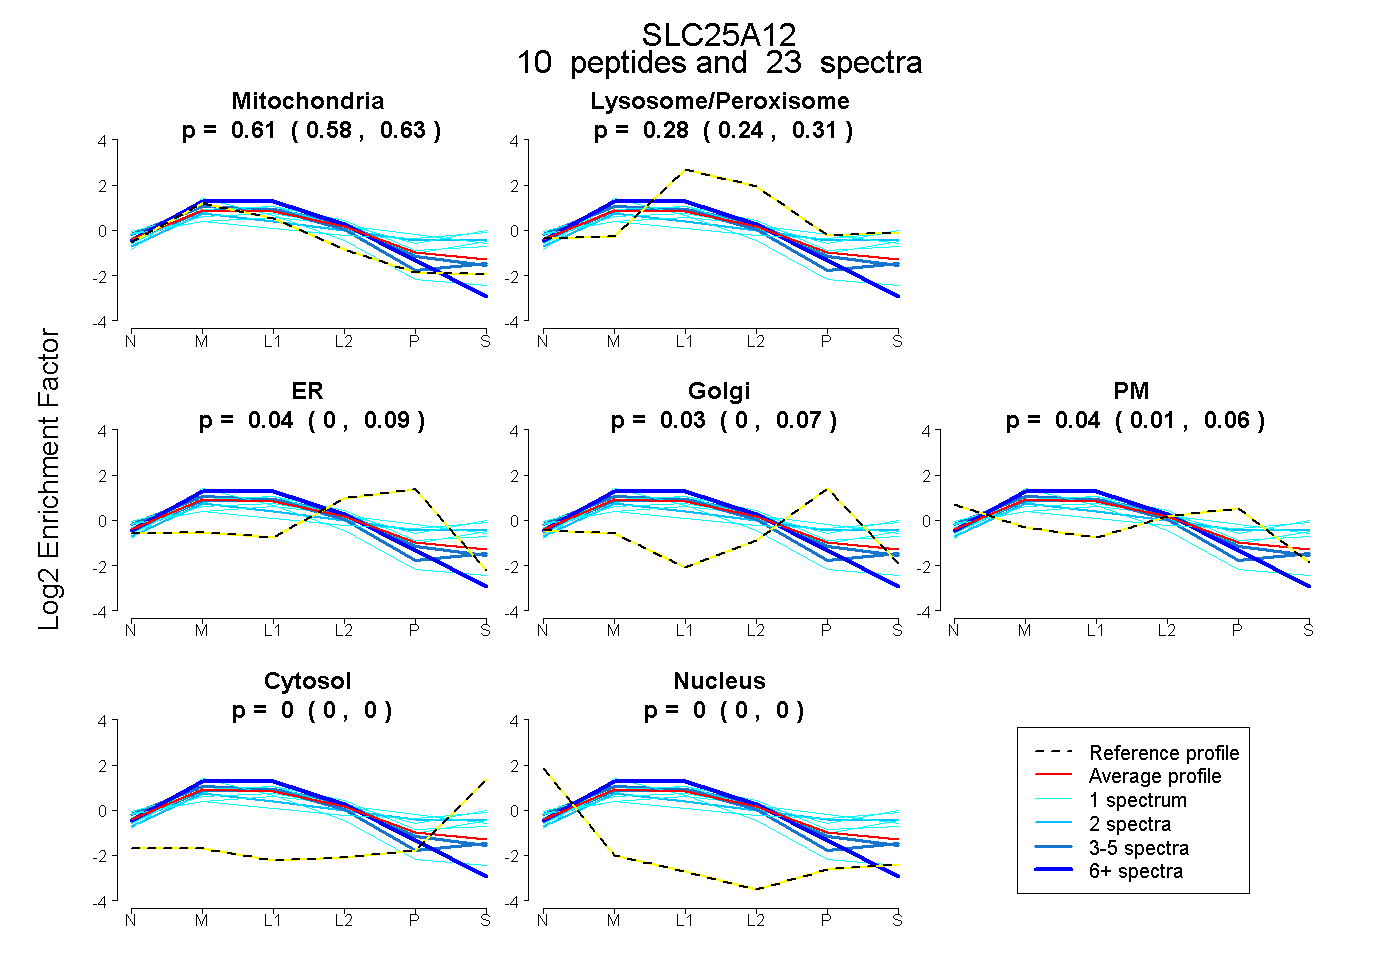
0.582 | 0.629
0.244 | 0.309
0.000 | 0.095
0.000 | 0.073
0.012 | 0.062
0.000 | 0.000
0.000 | 0.000
19peptides
spectra
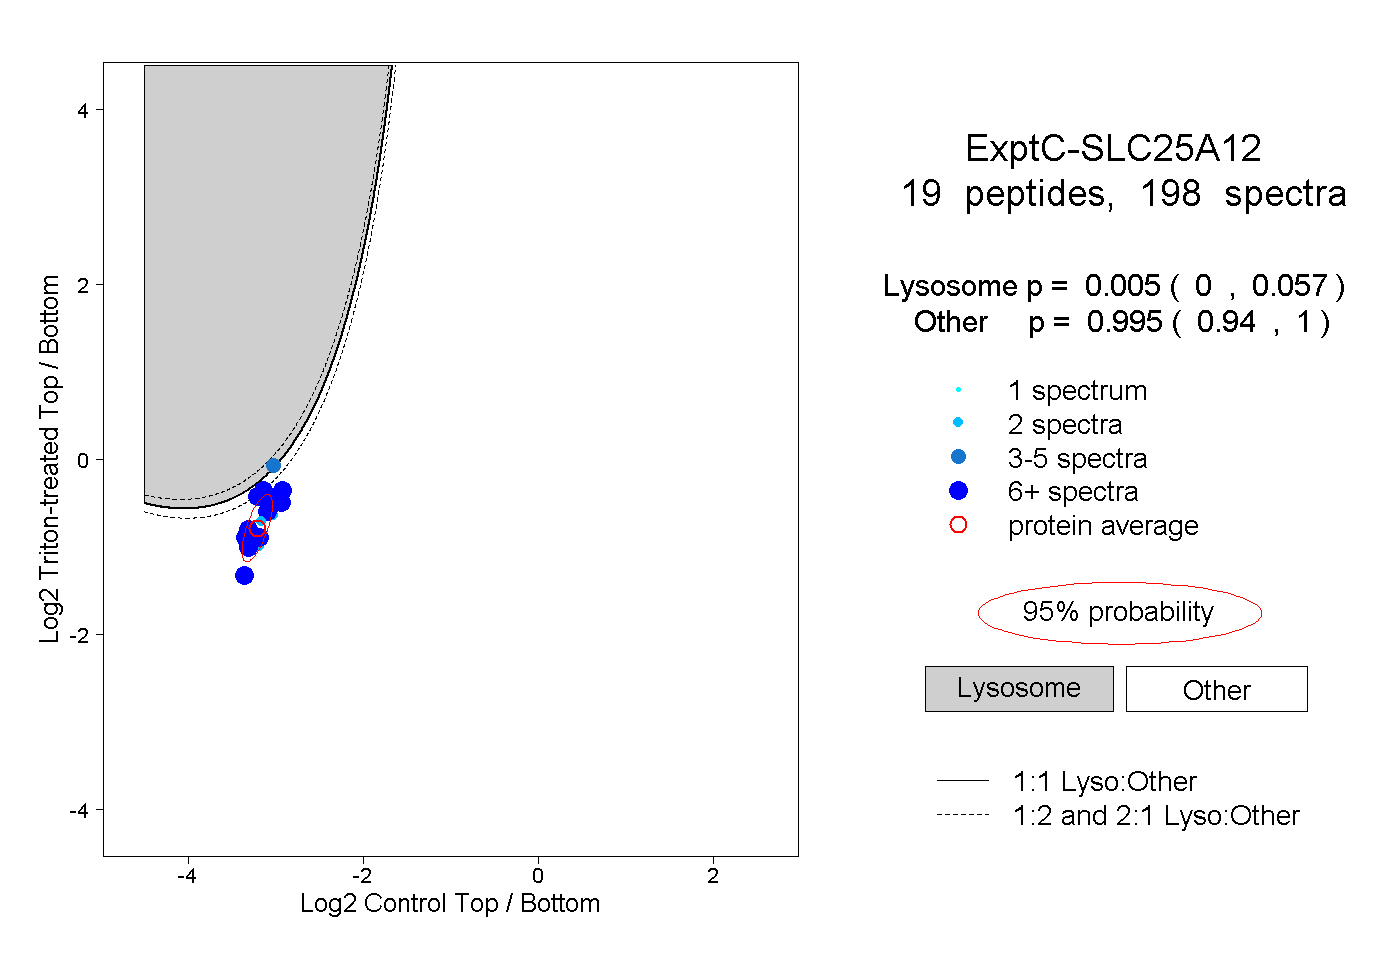
0.000 | 0.057
0.940 | 1.000
5peptides
spectra
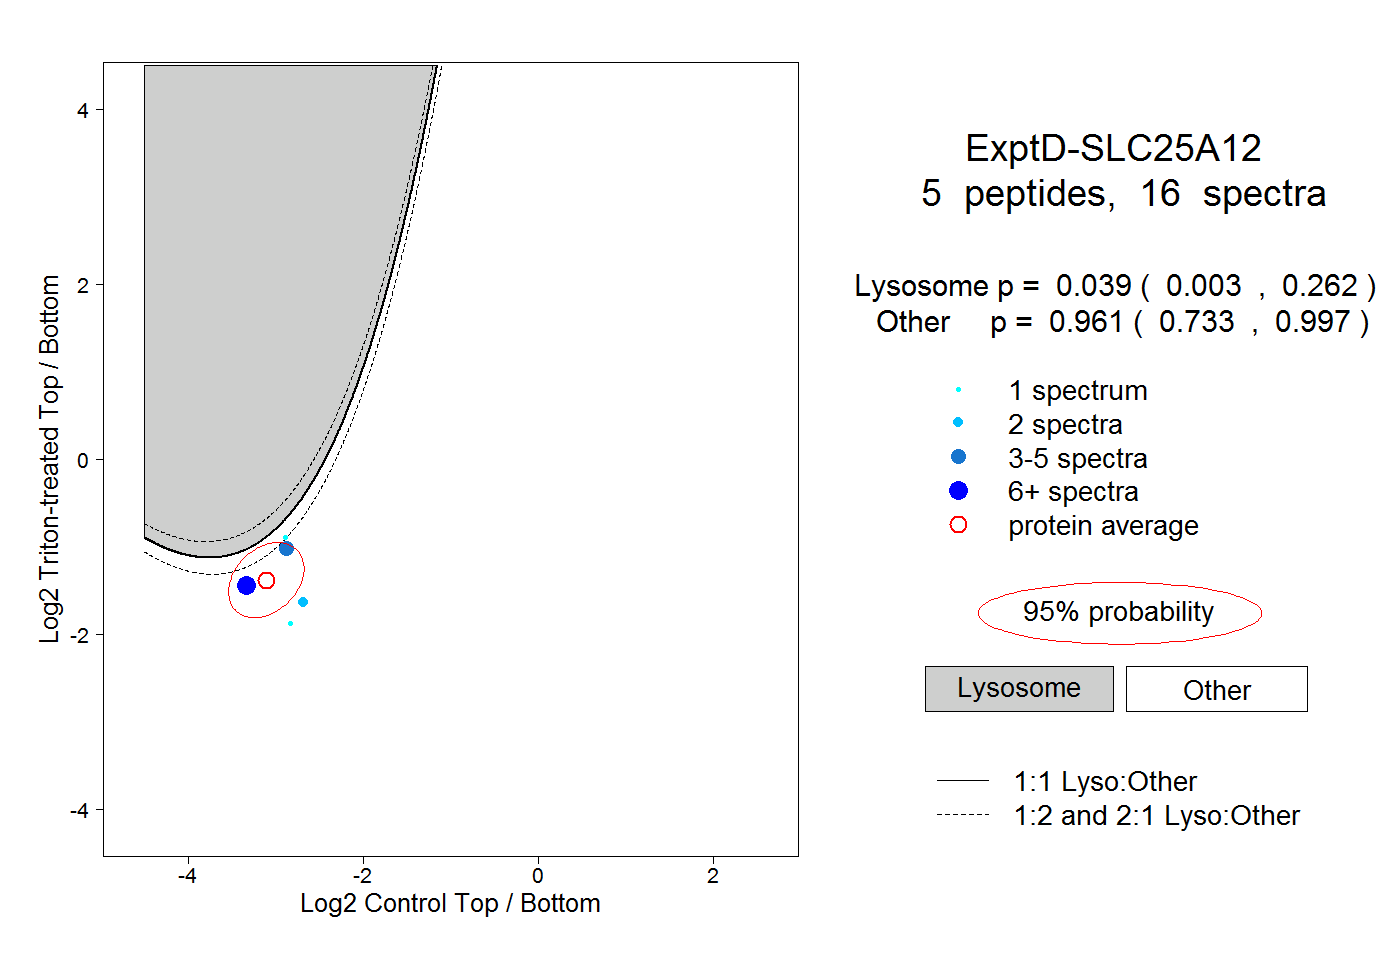
0.003 | 0.262
0.733 | 0.997