 17
17peptides
spectra
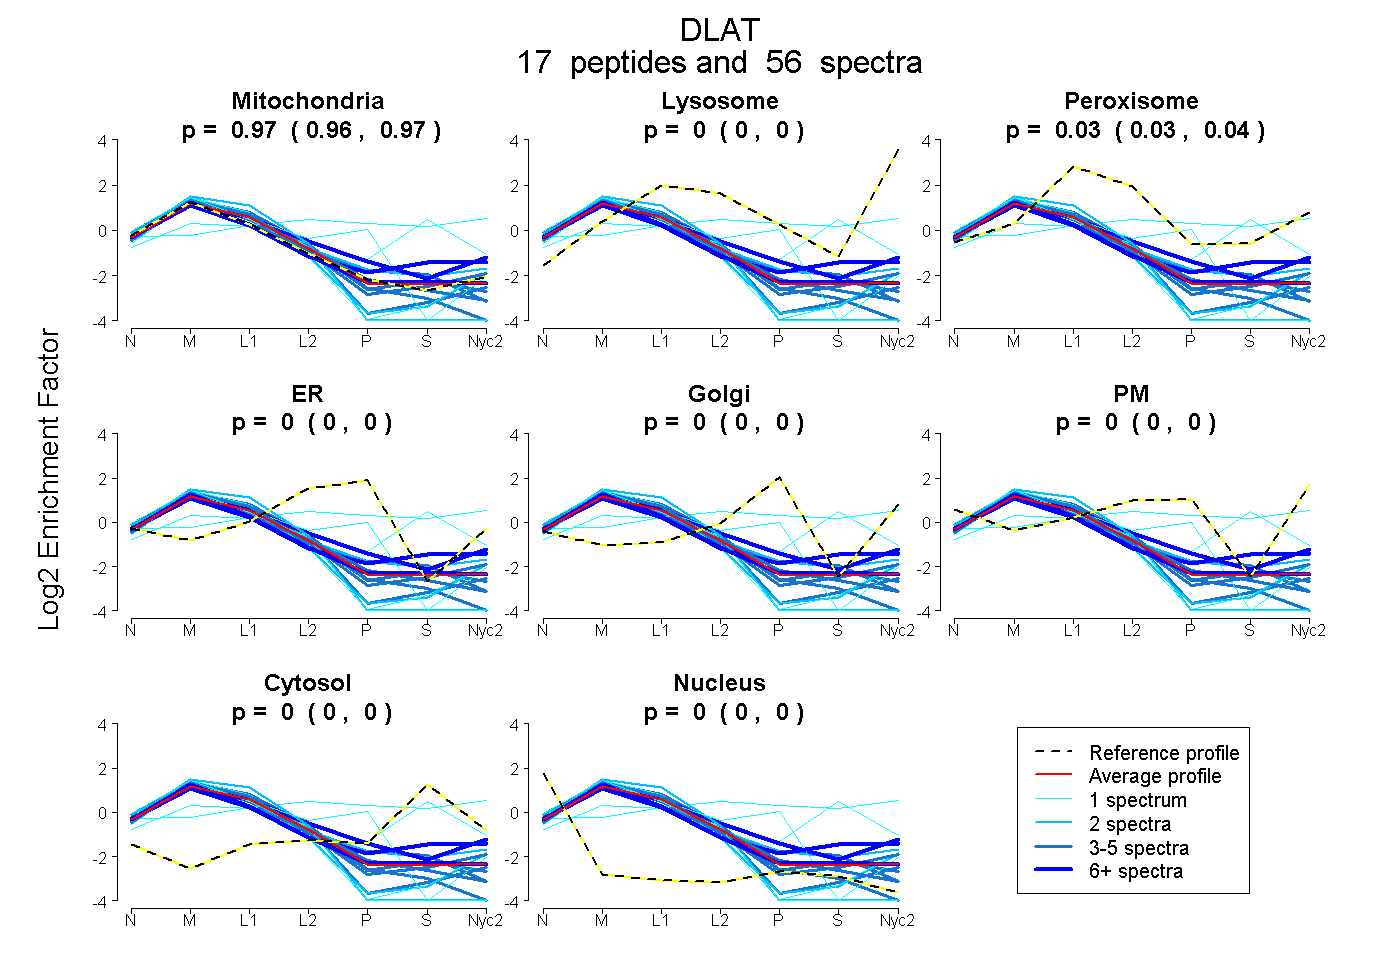
0.957 | 0.973
0.000 | 0.000
0.025 | 0.040
0.000 | 0.000
0.000 | 0.000
0.000 | 0.000
0.000 | 0.004
0.000 | 0.000
8peptides
spectra
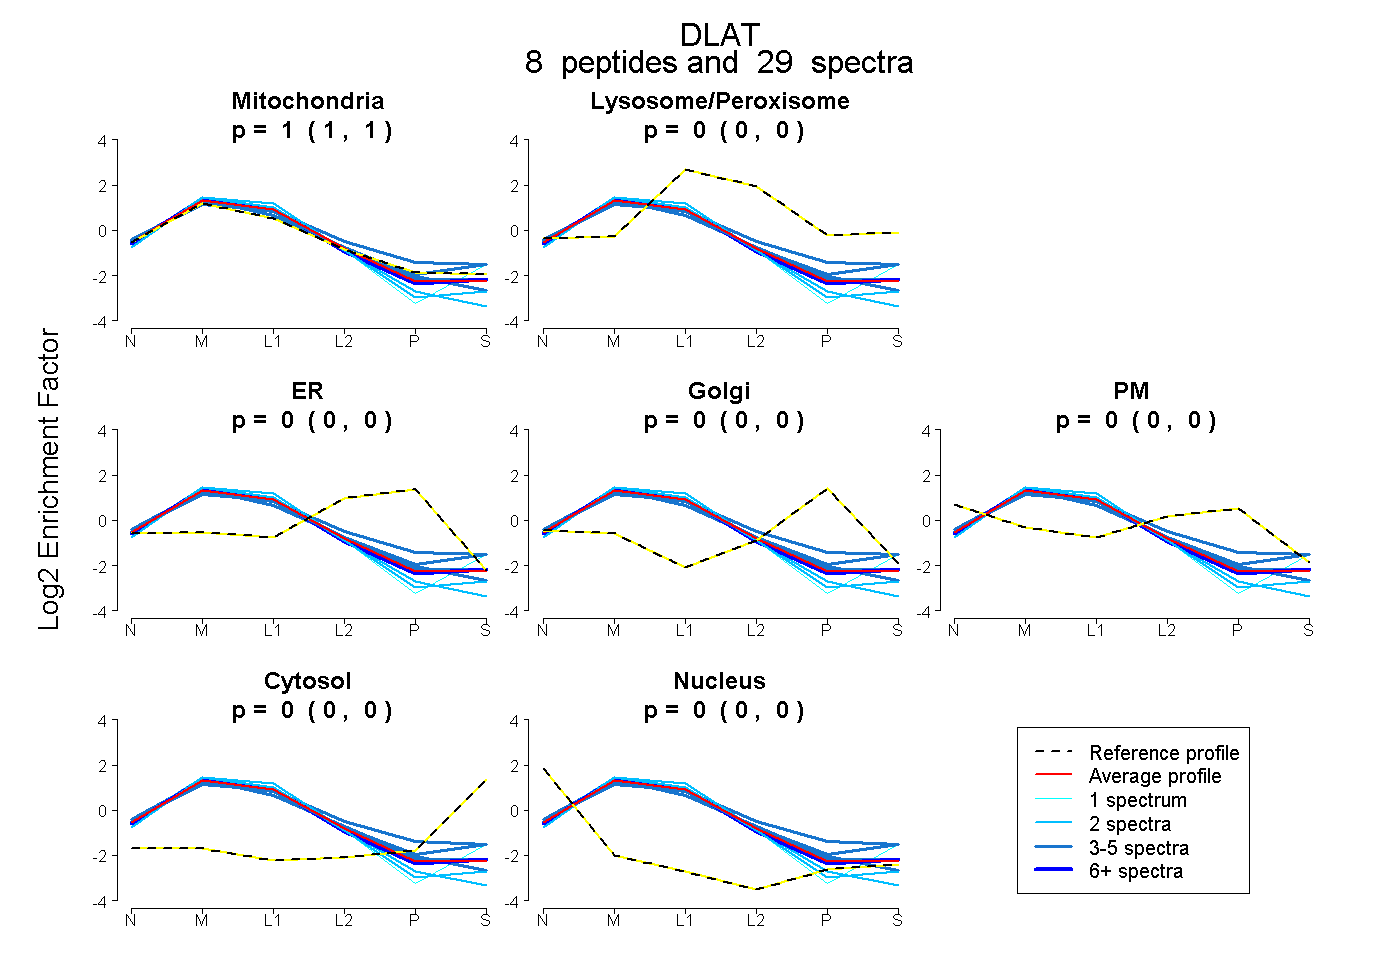
1.000 | 1.000
0.000 | 0.000
0.000 | 0.000
0.000 | 0.000
0.000 | 0.000
0.000 | 0.000
0.000 | 0.000
17peptides
spectra
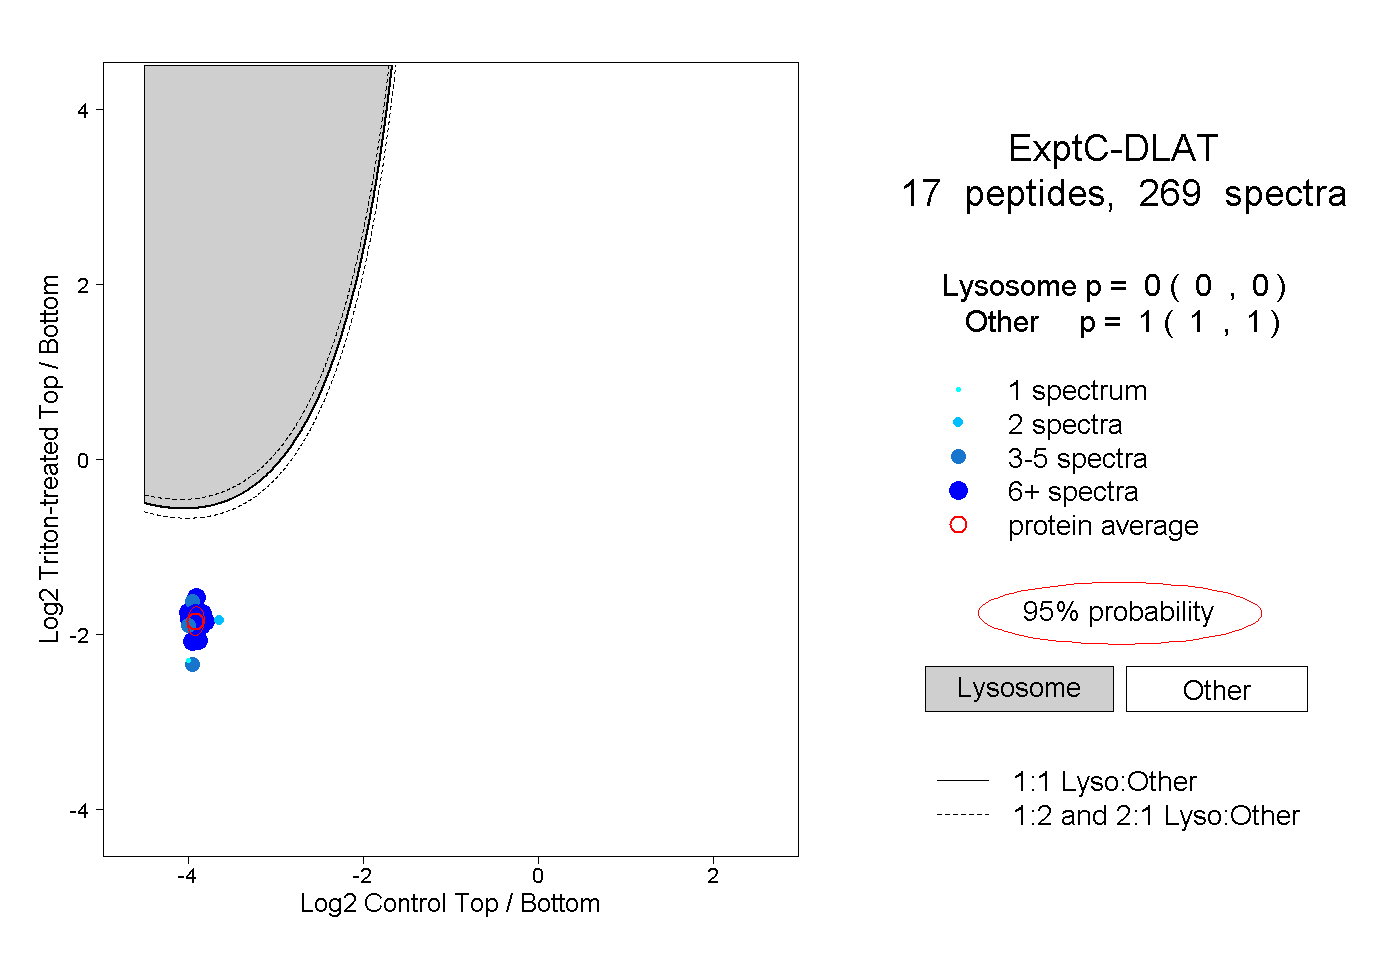
0.000 | 0.000
1.000 | 1.000
5peptides
spectra
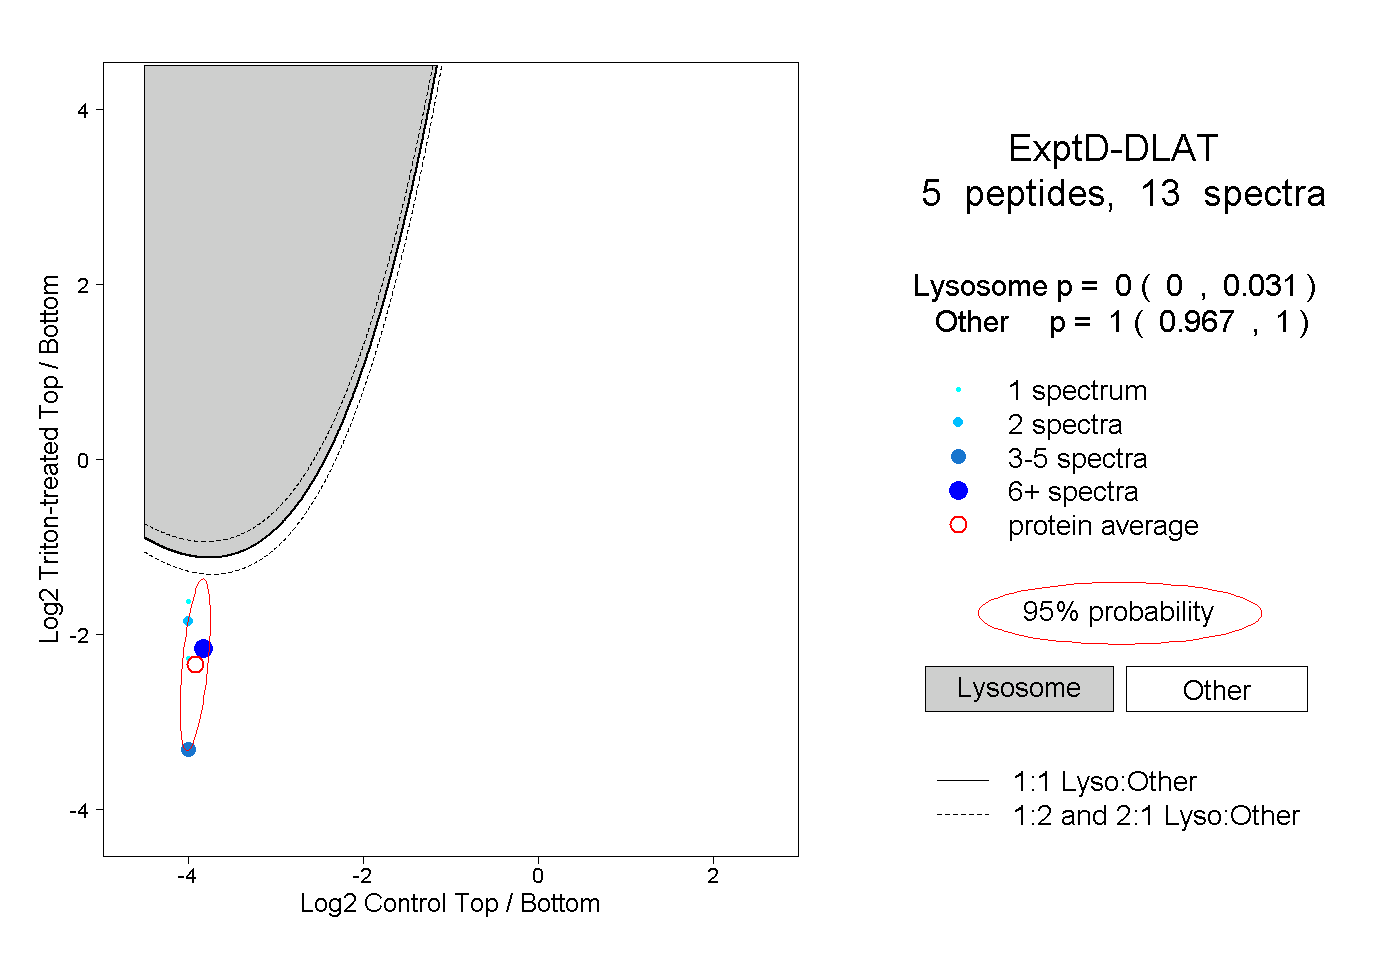
0.000 | 0.031
0.967 | 1.000