26
26peptides
spectra
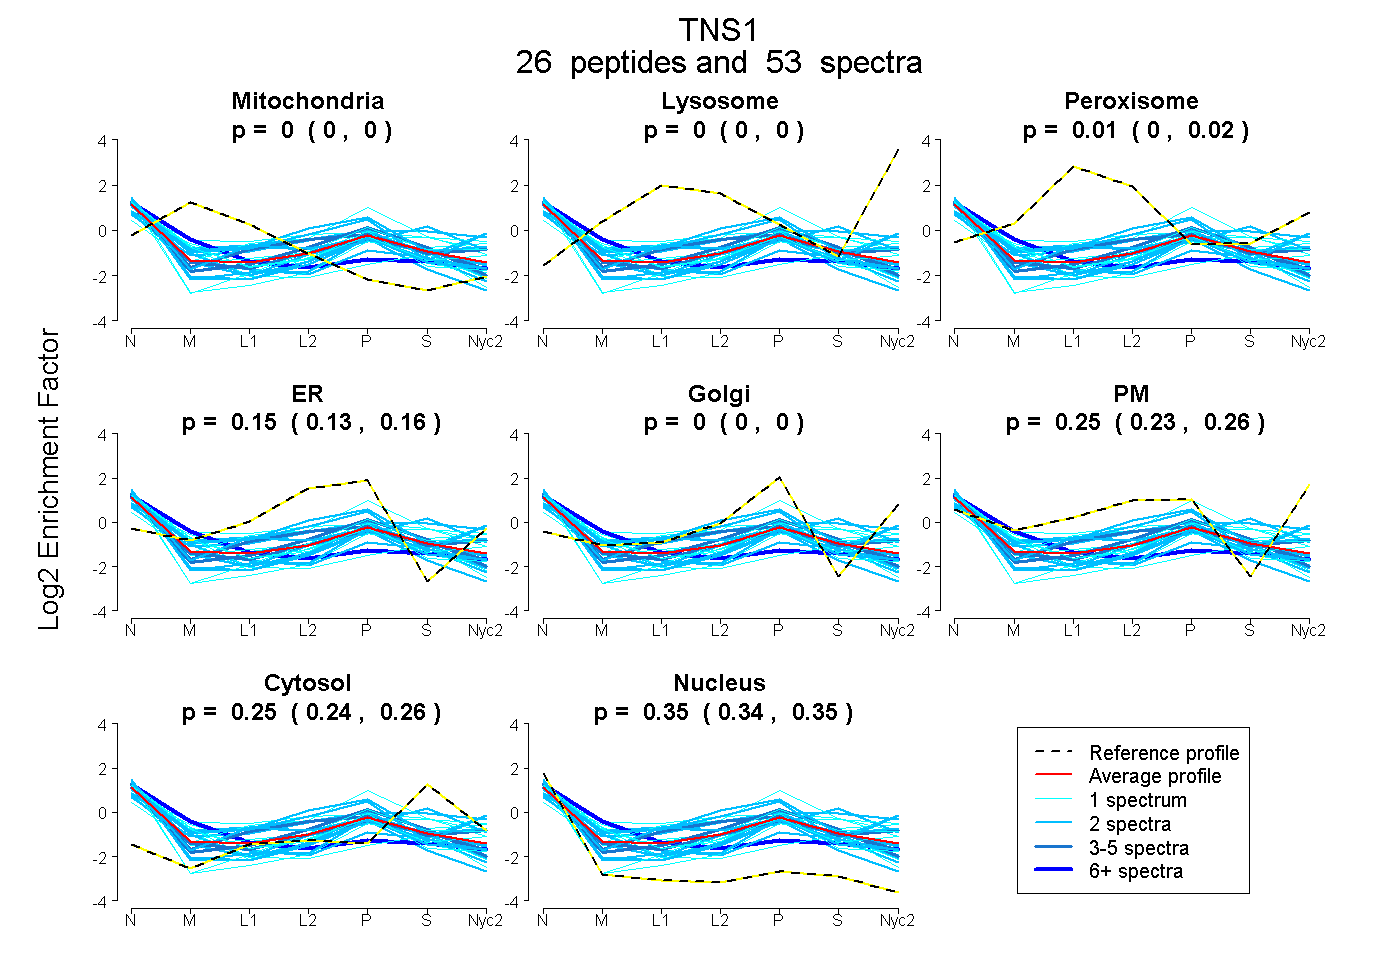
0.000 | 0.000
0.000 | 0.000
0.002 | 0.019
0.132 | 0.157
0.000 | 0.000
0.230 | 0.259
0.244 | 0.256
0.342 | 0.350
3peptides
spectra
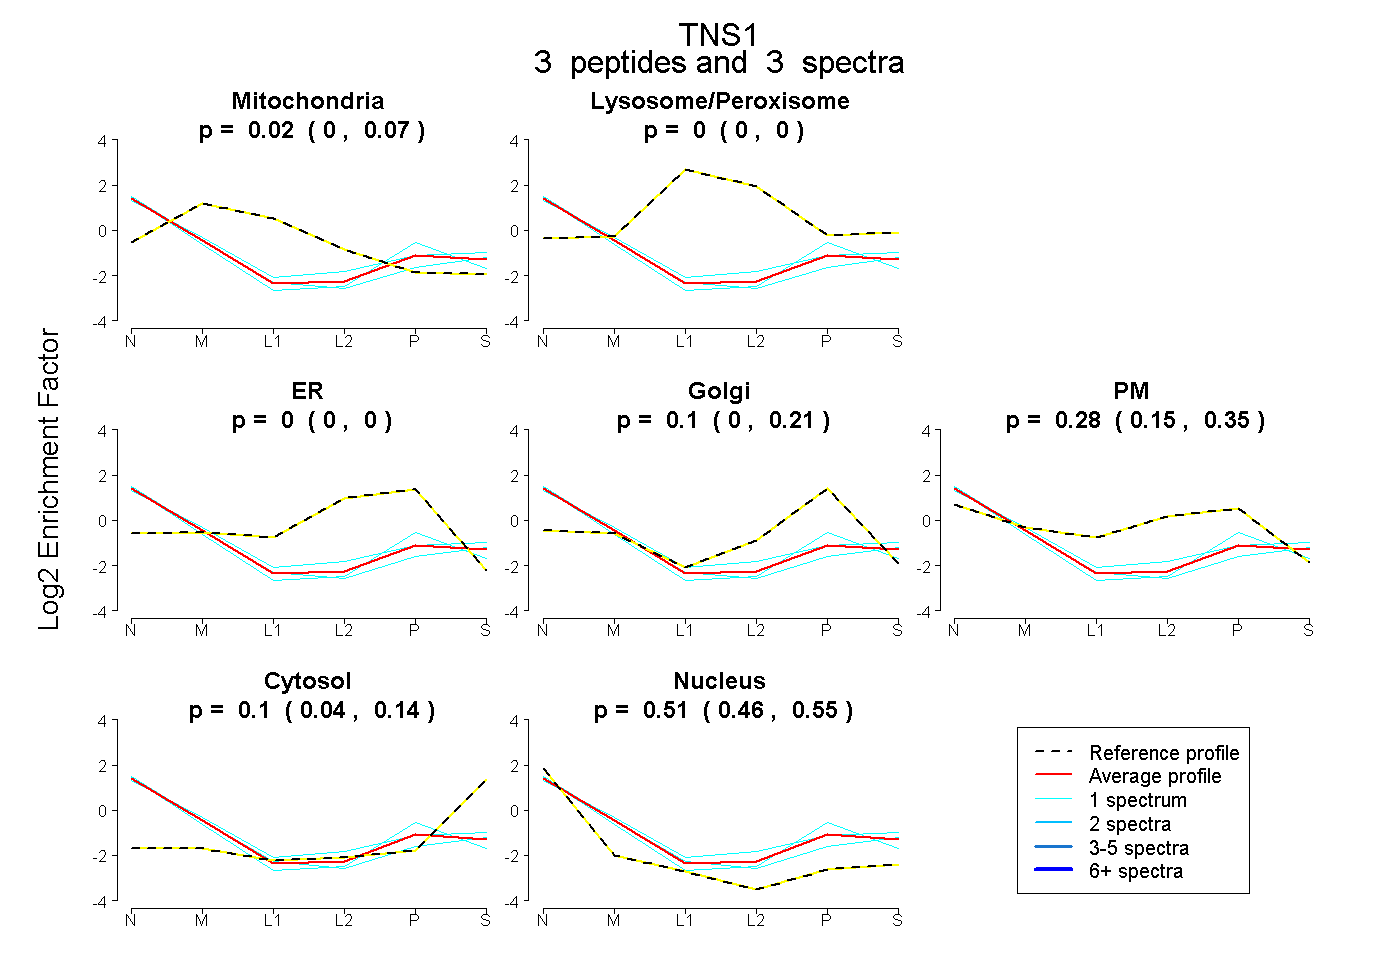
0.000 | 0.066
0.000 | 0.000
0.000 | 0.000
0.000 | 0.215
0.146 | 0.354
0.041 | 0.144
0.461 | 0.546
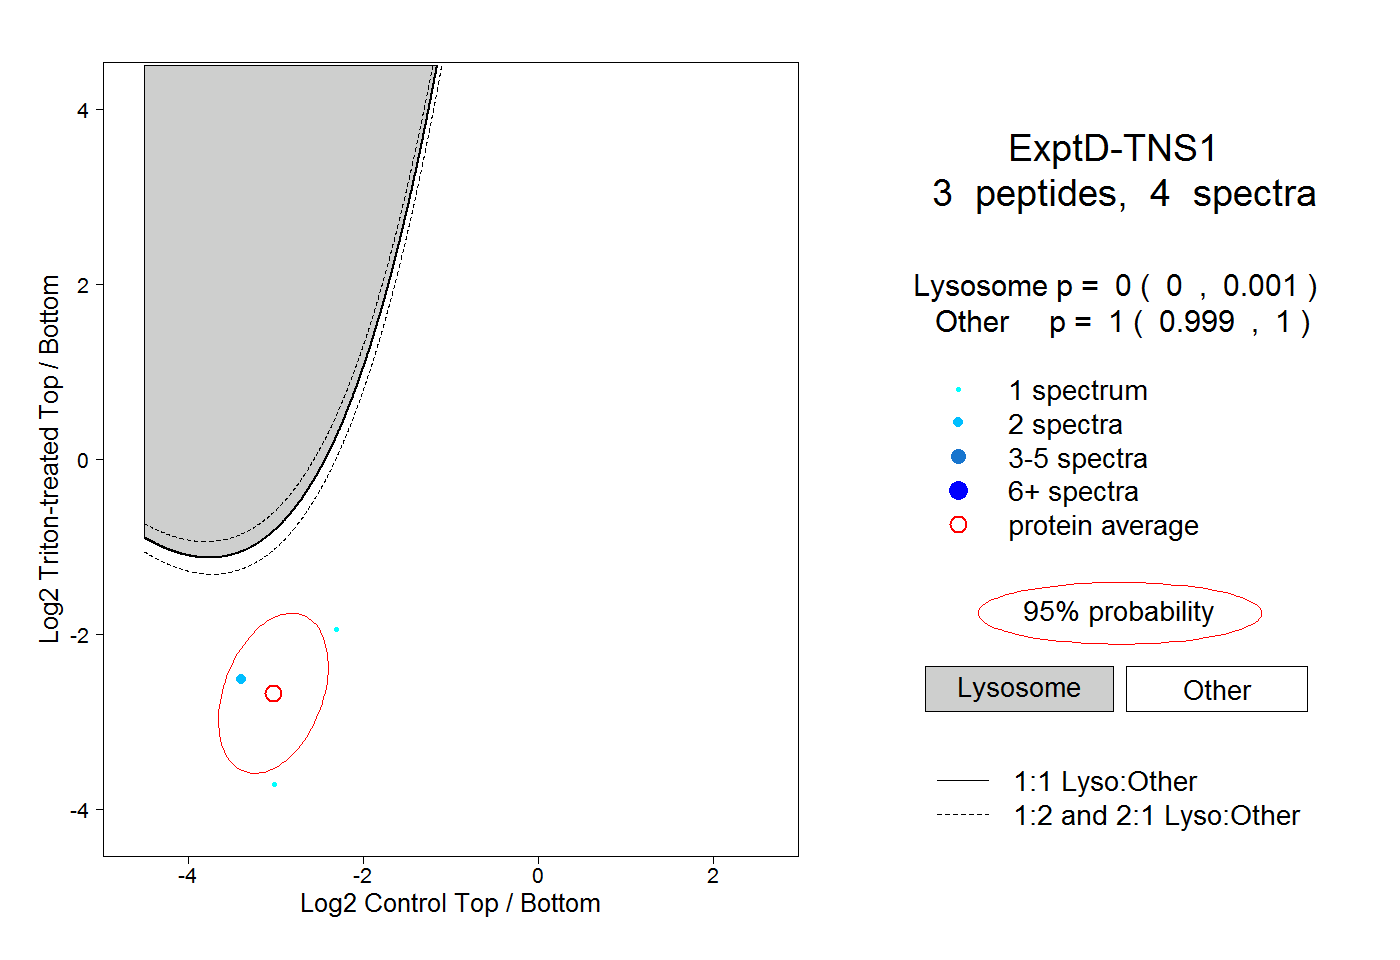
12peptides
spectra
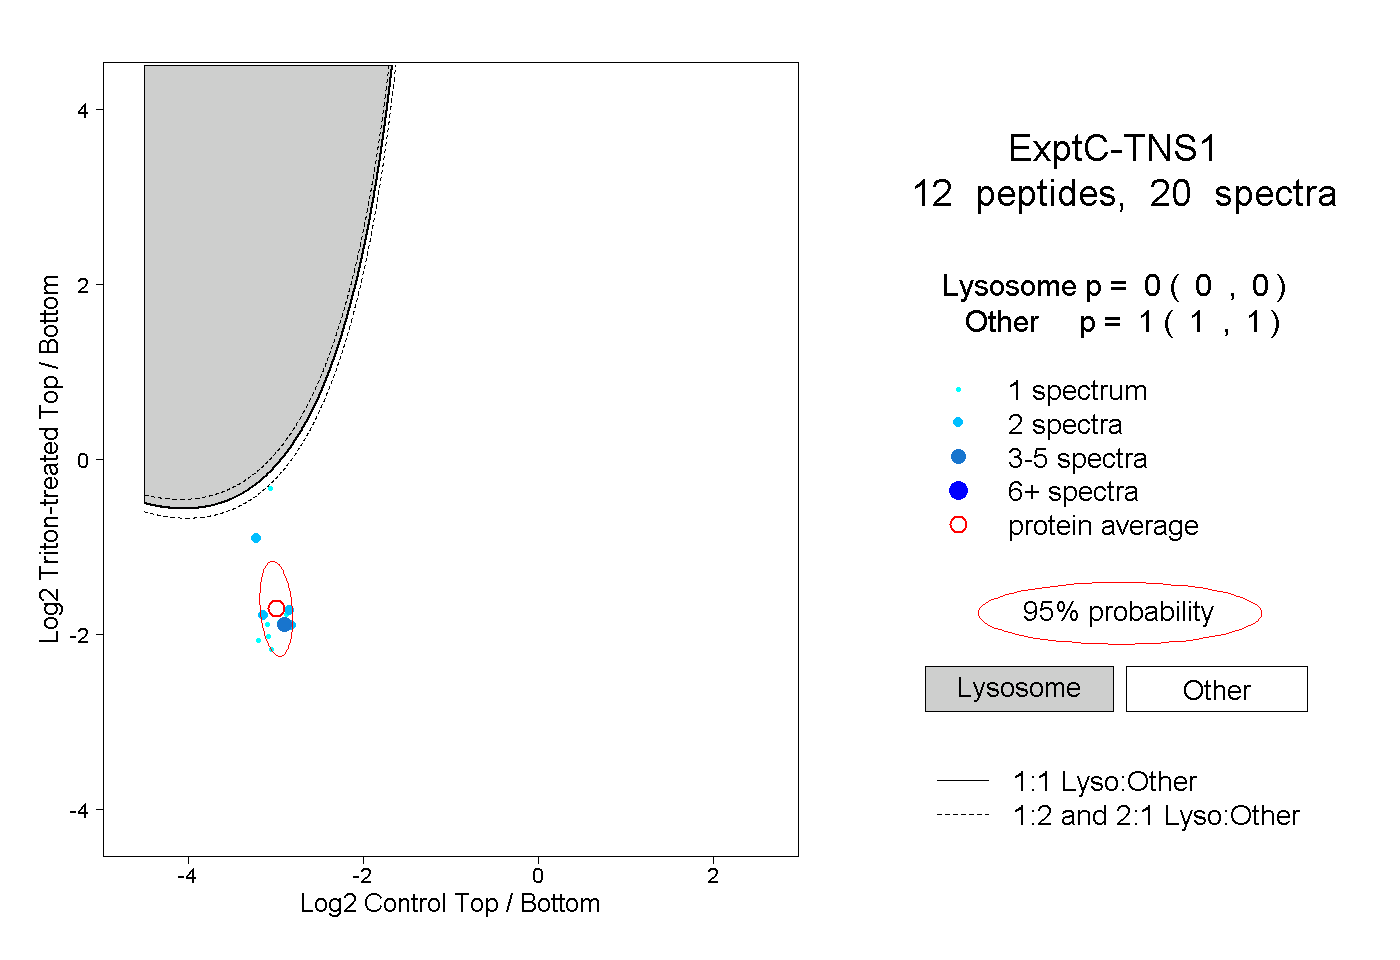
0.000 | 0.000
1.000 | 1.000