 26
26peptides
spectra
0.000 | 0.000
0.000 | 0.000
0.002 | 0.019
0.132 | 0.157
0.000 | 0.000
0.230 | 0.259
0.244 | 0.256
0.342 | 0.350
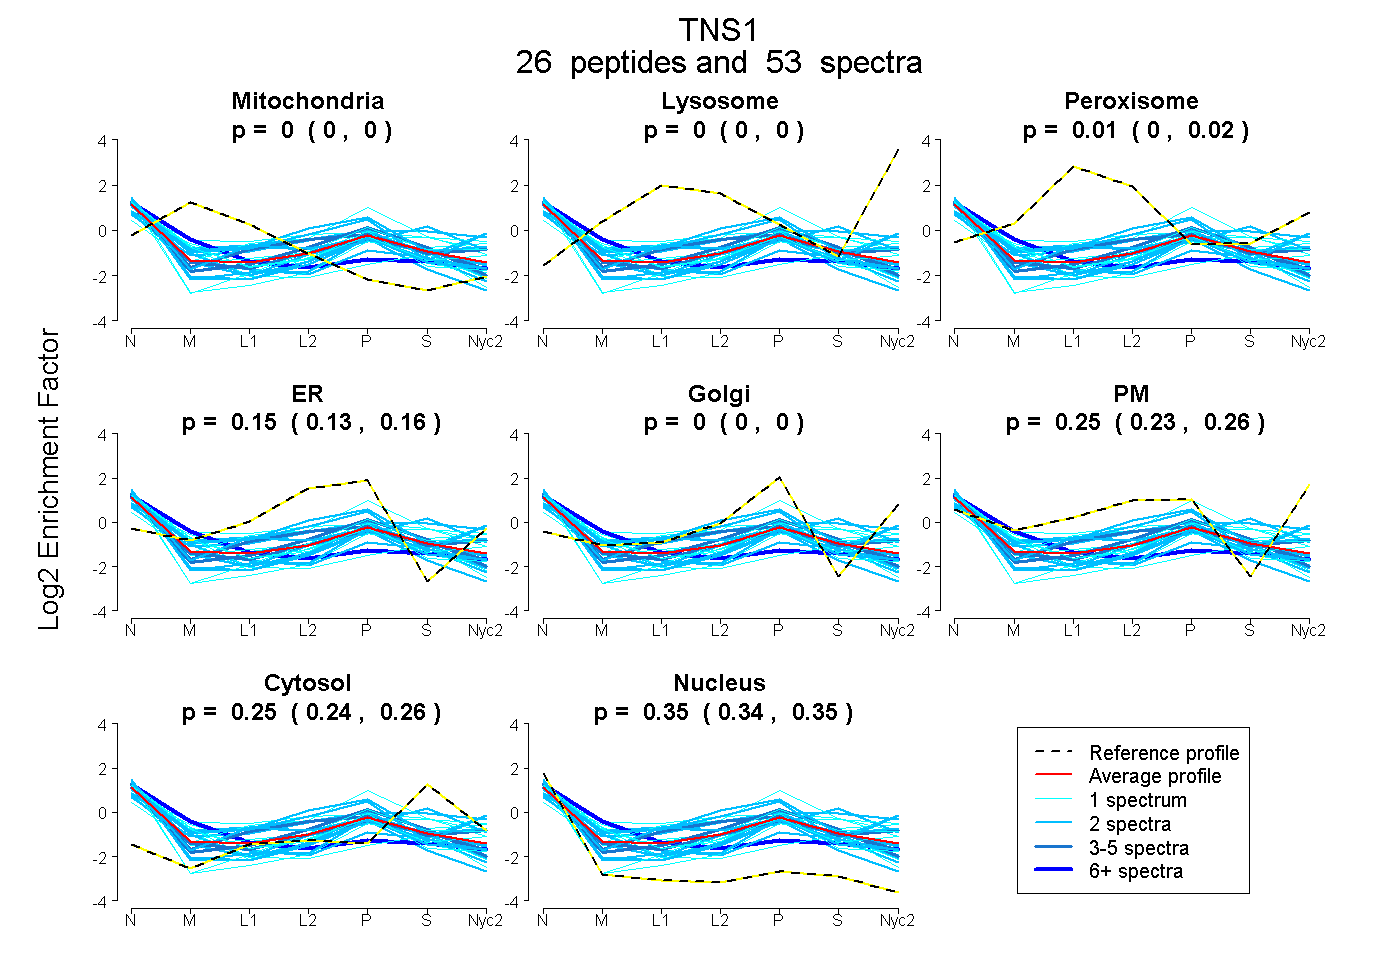
| Plot | Mito | Lyso | Perox | ER | Golgi | PM | Cytosol | Nucleus | |||||
| Expt A |
26 peptides |
53 spectra |
|
0.000 0.000 | 0.000 |
0.000 0.000 | 0.000 |
0.011 0.002 | 0.019 |
0.147 0.132 | 0.157 |
0.000 0.000 | 0.000 |
0.245 0.230 | 0.259 |
0.251 0.244 | 0.256 |
0.346 0.342 | 0.350 |
| 2 spectra, EQAIALLK | 0.000 | 0.000 | 0.073 | 0.000 | 0.000 | 0.528 | 0.181 | 0.218 | ||
| 1 spectrum, ATSETLAADPTPAATIVHFK | 0.072 | 0.000 | 0.000 | 0.141 | 0.150 | 0.091 | 0.119 | 0.428 | ||
| 1 spectrum, TVGTNTPPSPGFGR | 0.000 | 0.000 | 0.000 | 0.000 | 0.283 | 0.121 | 0.283 | 0.313 | ||
| 2 spectra, VSSPPPTITQQGK | 0.000 | 0.000 | 0.000 | 0.089 | 0.000 | 0.552 | 0.176 | 0.183 | ||
| 3 spectra, TPIQPMLDSSIR | 0.000 | 0.000 | 0.068 | 0.087 | 0.000 | 0.348 | 0.209 | 0.289 | ||
| 1 spectrum, IVPIGQPSQR | 0.233 | 0.000 | 0.000 | 0.000 | 0.000 | 0.100 | 0.227 | 0.441 | ||
| 2 spectra, GYDPSGLFR | 0.076 | 0.000 | 0.074 | 0.000 | 0.132 | 0.042 | 0.163 | 0.513 | ||
| 4 spectra, RPTLSR | 0.000 | 0.000 | 0.000 | 0.385 | 0.000 | 0.000 | 0.277 | 0.338 | ||
| 2 spectra, HFLIETGPR | 0.027 | 0.000 | 0.212 | 0.241 | 0.000 | 0.000 | 0.122 | 0.398 | ||
| 1 spectrum, YWYKPEISR | 0.082 | 0.000 | 0.000 | 0.000 | 0.119 | 0.308 | 0.149 | 0.342 | ||
| 1 spectrum, TEGGAPAK | 0.000 | 0.000 | 0.009 | 0.456 | 0.063 | 0.000 | 0.388 | 0.084 | ||
| 2 spectra, TAVAGPR | 0.000 | 0.000 | 0.000 | 0.020 | 0.267 | 0.066 | 0.238 | 0.410 | ||
| 2 spectra, VSAQGITLTDNQR | 0.000 | 0.000 | 0.043 | 0.315 | 0.000 | 0.261 | 0.219 | 0.161 | ||
| 2 spectra, LFGFVAR | 0.000 | 0.000 | 0.000 | 0.000 | 0.000 | 0.267 | 0.511 | 0.222 | ||
| 2 spectra, VAGVQAR | 0.000 | 0.000 | 0.191 | 0.223 | 0.000 | 0.051 | 0.114 | 0.421 | ||
| 2 spectra, DQEPGAFIIR | 0.089 | 0.000 | 0.000 | 0.333 | 0.000 | 0.000 | 0.067 | 0.511 | ||
| 9 spectra, GGCRPFLR | 0.298 | 0.000 | 0.000 | 0.000 | 0.000 | 0.208 | 0.150 | 0.343 | ||
| 1 spectrum, LVIPSR | 0.000 | 0.000 | 0.000 | 0.000 | 0.000 | 0.389 | 0.390 | 0.221 | ||
| 3 spectra, TPEEEPLNLEGLVAHR | 0.000 | 0.000 | 0.007 | 0.191 | 0.000 | 0.164 | 0.255 | 0.382 | ||
| 2 spectra, EDLDEAFK | 0.000 | 0.000 | 0.018 | 0.000 | 0.000 | 0.434 | 0.444 | 0.105 | ||
| 1 spectrum, VMLSAGQK | 0.158 | 0.000 | 0.000 | 0.090 | 0.263 | 0.059 | 0.067 | 0.361 | ||
| 1 spectrum, GAYGLAMK | 0.126 | 0.000 | 0.000 | 0.000 | 0.116 | 0.249 | 0.364 | 0.145 | ||
| 2 spectra, YSMPDNSPETR | 0.000 | 0.000 | 0.000 | 0.000 | 0.257 | 0.099 | 0.155 | 0.489 | ||
| 1 spectrum, SGYIPSGDTLGAPELLSSGR | 0.000 | 0.000 | 0.000 | 0.076 | 0.117 | 0.000 | 0.259 | 0.549 | ||
| 2 spectra, SYVESVAR | 0.000 | 0.000 | 0.000 | 0.000 | 0.189 | 0.133 | 0.246 | 0.432 | ||
| 1 spectrum, DSHSFR | 0.071 | 0.000 | 0.151 | 0.037 | 0.000 | 0.358 | 0.212 | 0.171 |
| Plot | Mito | Lyso or Perox | ER | Golgi | PM | Cytosol | Nucleus | ||||||
| Expt B |
3 peptides |
3 spectra |
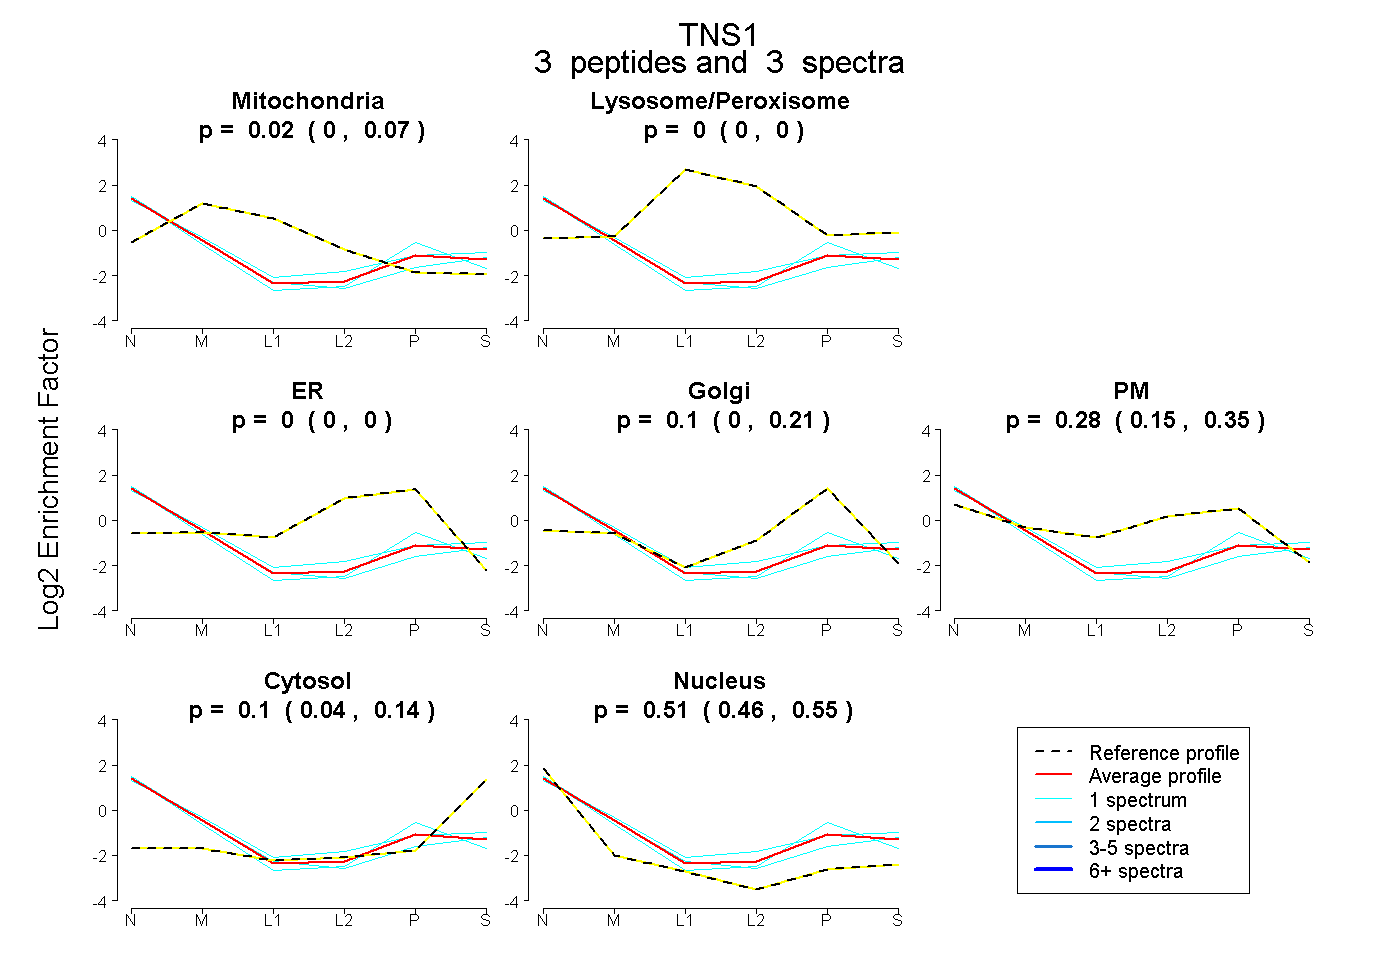 |
0.016 0.000 | 0.066 |
0.000 0.000 | 0.000 |
0.000 0.000 | 0.000 |
0.096 0.000 | 0.215 |
0.279 0.146 | 0.354 |
0.101 0.041 | 0.144 |
0.508 0.461 | 0.546 |
|||
| Plot | Lyso | Other | |||||||||||
| Expt C |
12 peptides |
20 spectra |
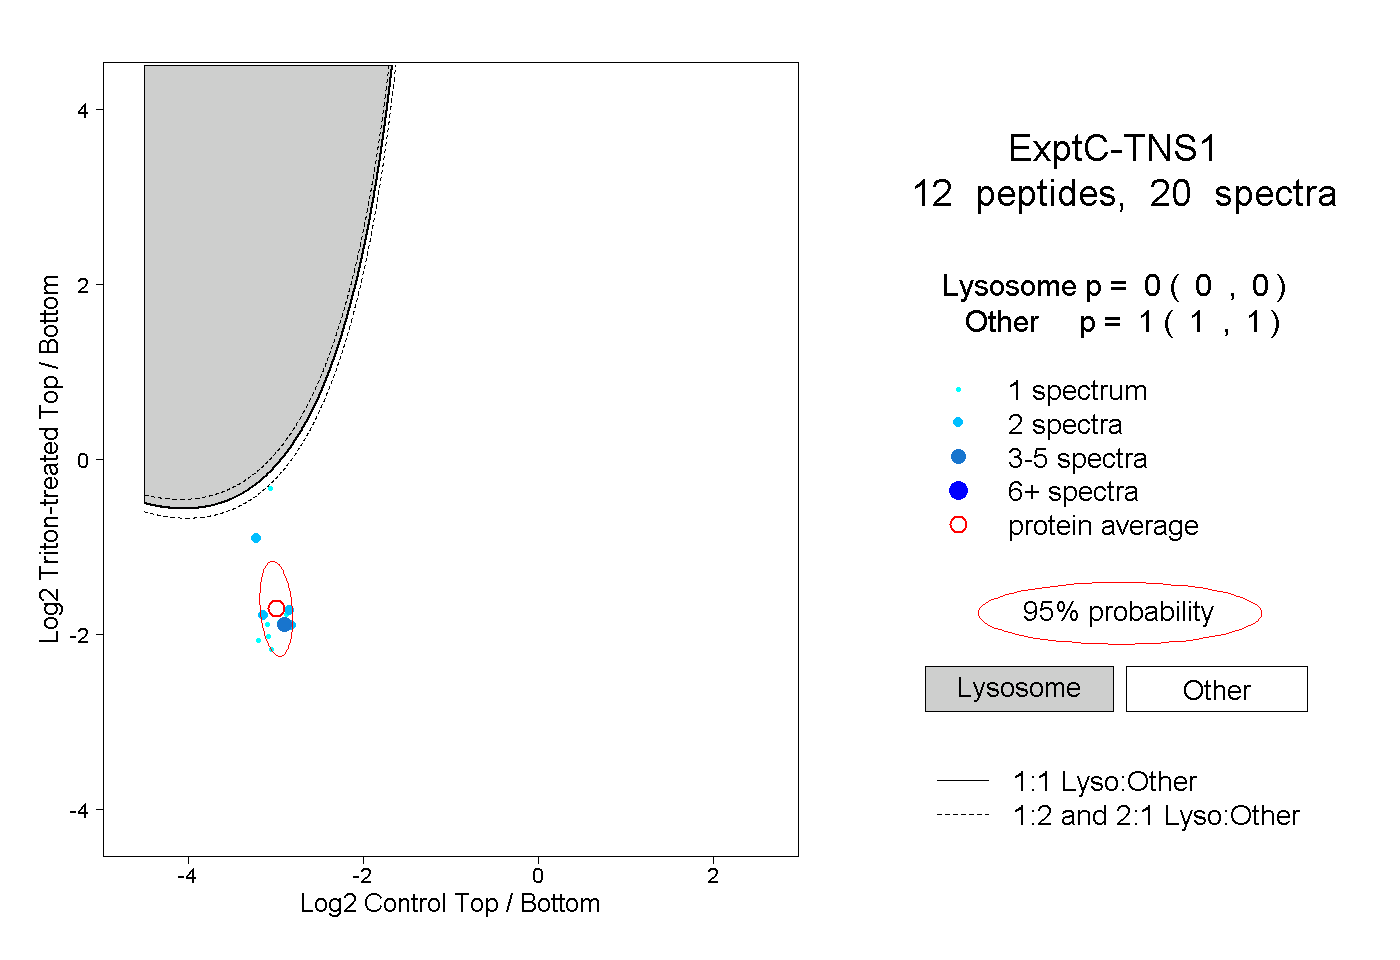 |
0.000 0.000 | 0.000 |
1.000 1.000 | 1.000 |
||||||||
| Plot | Lyso | Other | |||||||||||
| Expt D |
3 peptides |
4 spectra |
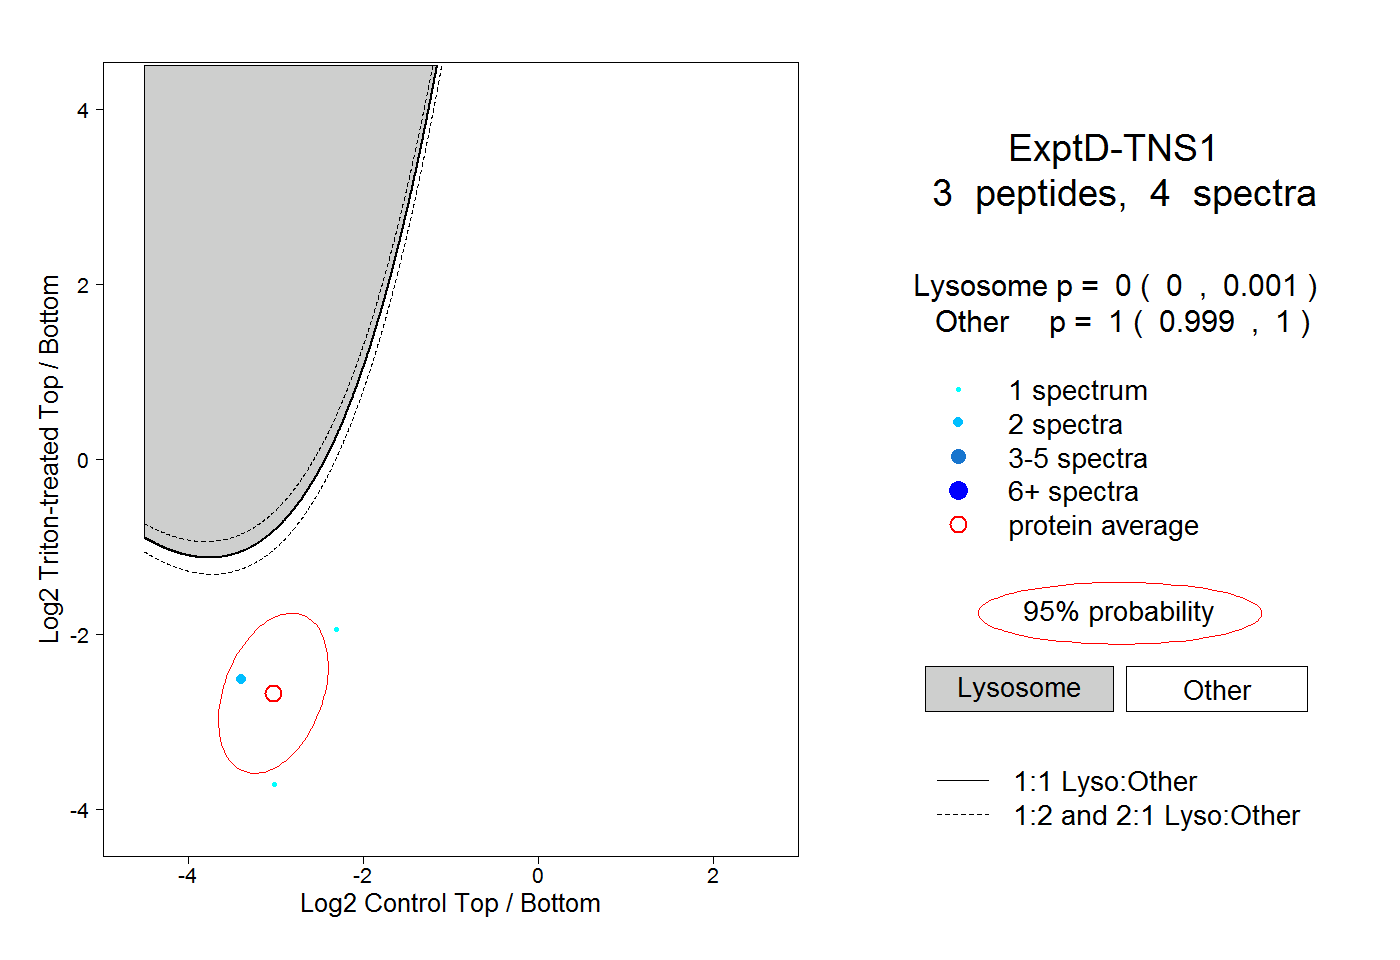 |
0.000 0.000 | 0.001 |
1.000 0.999 | 1.000 |