 4
4peptides
spectra
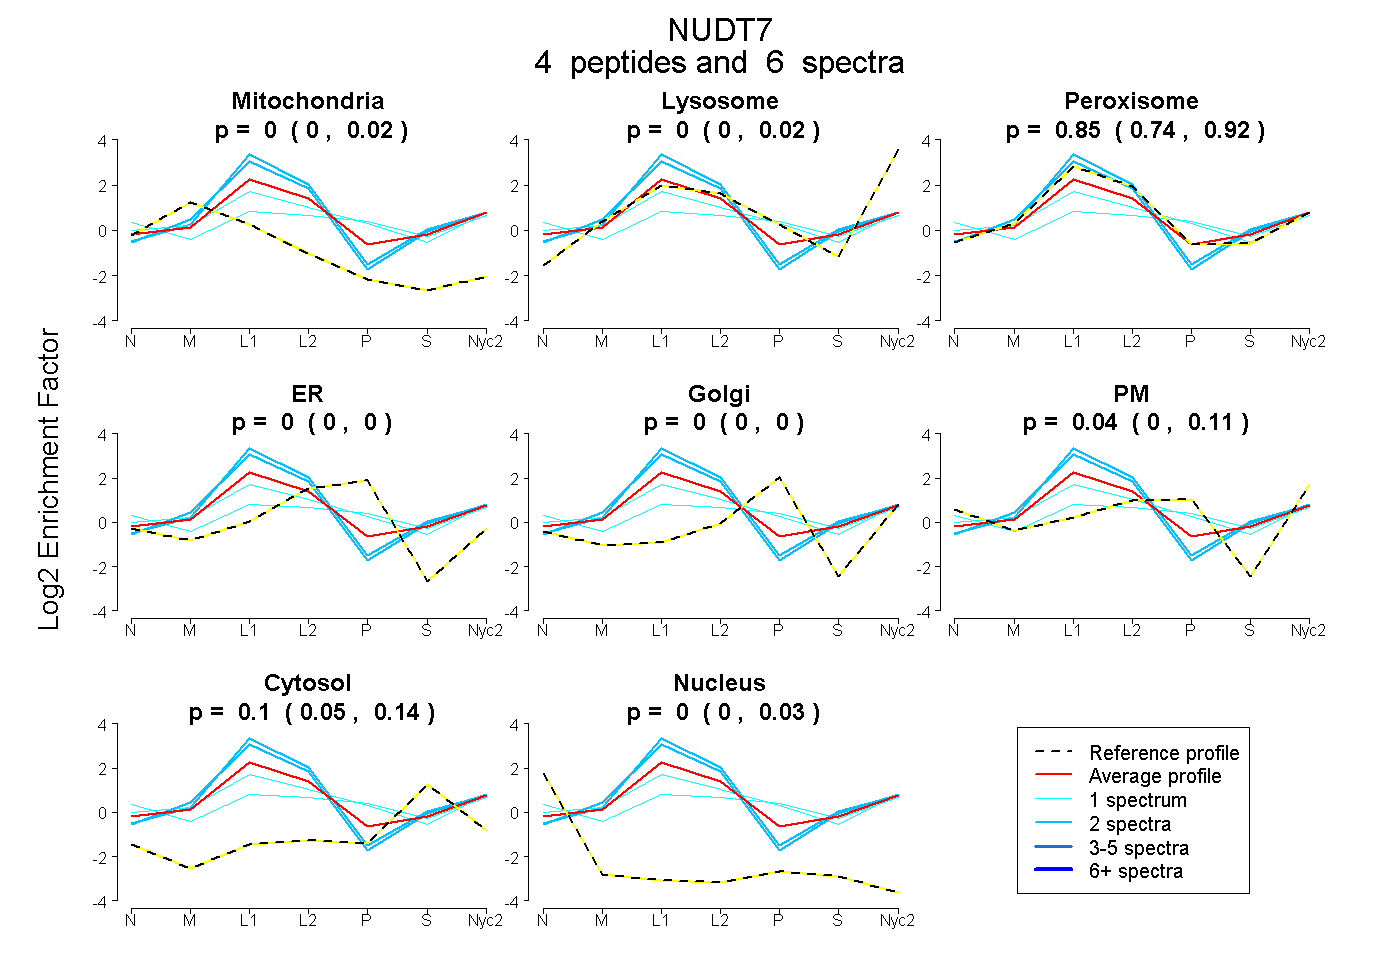
0.000 | 0.021
0.000 | 0.020
0.738 | 0.921
0.000 | 0.000
0.000 | 0.000
0.000 | 0.114
0.053 | 0.137
0.000 | 0.030
| Plot | Mito | Lyso | Perox | ER | Golgi | PM | Cytosol | Nucleus | |||||
| Expt A |
4 peptides |
6 spectra |
|
0.000 0.000 | 0.021 |
0.000 0.000 | 0.020 |
0.851 0.738 | 0.921 |
0.000 0.000 | 0.000 |
0.000 0.000 | 0.000 |
0.042 0.000 | 0.114 |
0.104 0.053 | 0.137 |
0.003 0.000 | 0.030 |
| 2 spectra, YSVLLPLLAR | 0.006 | 0.000 | 0.982 | 0.000 | 0.000 | 0.000 | 0.012 | 0.000 | ||
| 1 spectrum, APGEVCFPGGK | 0.000 | 0.000 | 0.359 | 0.000 | 0.000 | 0.409 | 0.232 | 0.000 | ||
| 2 spectra, DPVDADDTATALR | 0.000 | 0.000 | 1.000 | 0.000 | 0.000 | 0.000 | 0.000 | 0.000 | ||
| 1 spectrum, NNLIDDAK | 0.000 | 0.000 | 0.652 | 0.000 | 0.124 | 0.163 | 0.062 | 0.000 |
| Plot | Mito | Lyso or Perox | ER | Golgi | PM | Cytosol | Nucleus | ||||||
| Expt B |
2 peptides |
4 spectra |
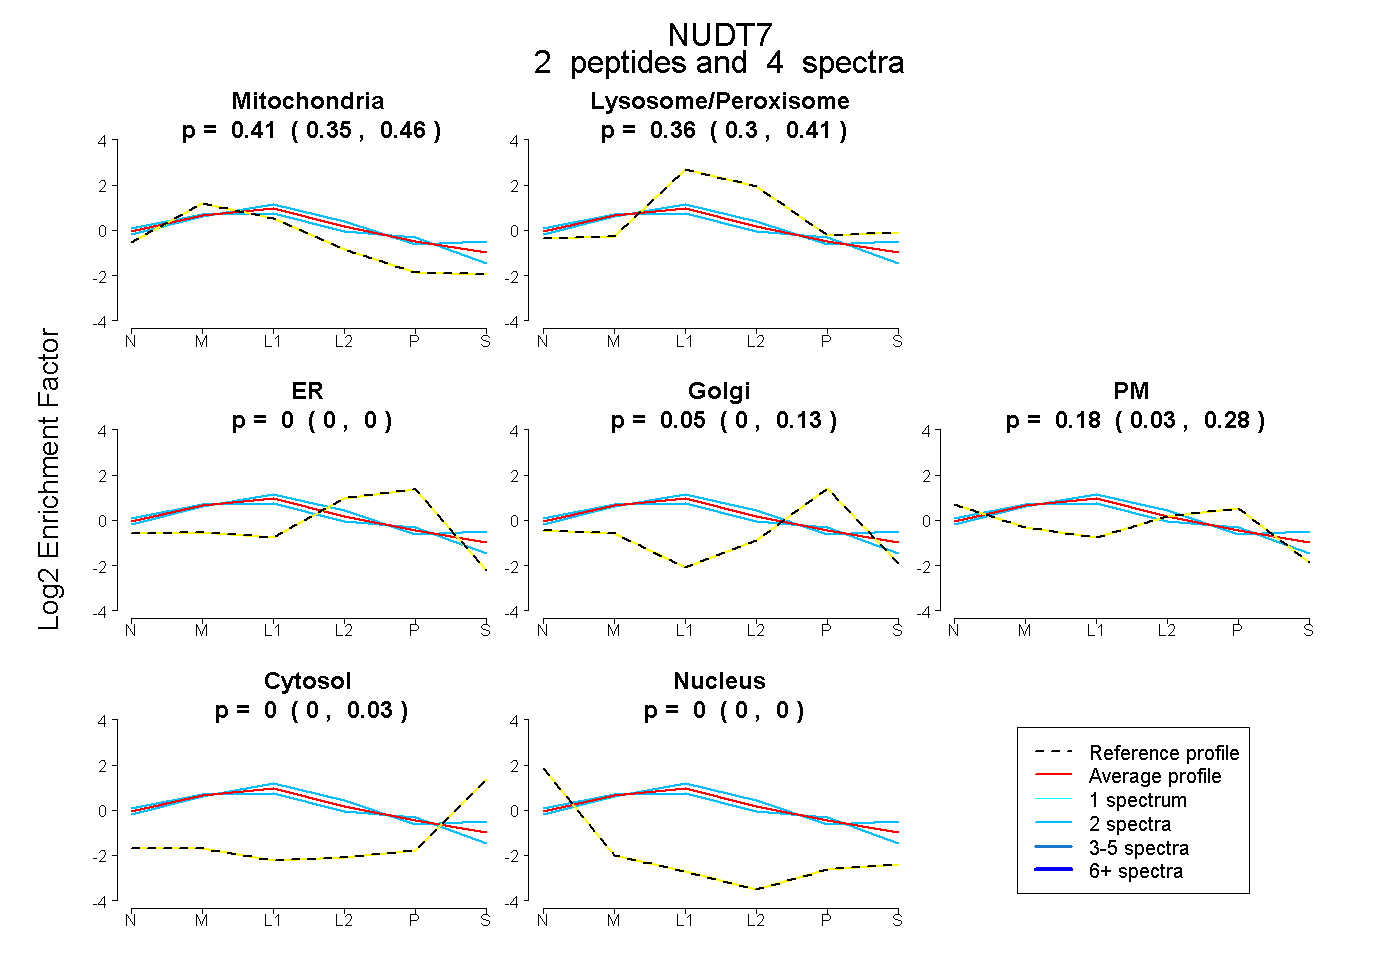 |
0.411 0.346 | 0.457 |
0.357 0.300 | 0.406 |
0.000 0.000 | 0.000 |
0.051 0.000 | 0.128 |
0.182 0.026 | 0.277 |
0.000 0.000 | 0.033 |
0.000 0.000 | 0.000 |
|||
| Plot | Lyso | Other | |||||||||||
| Expt C |
8 peptides |
41 spectra |
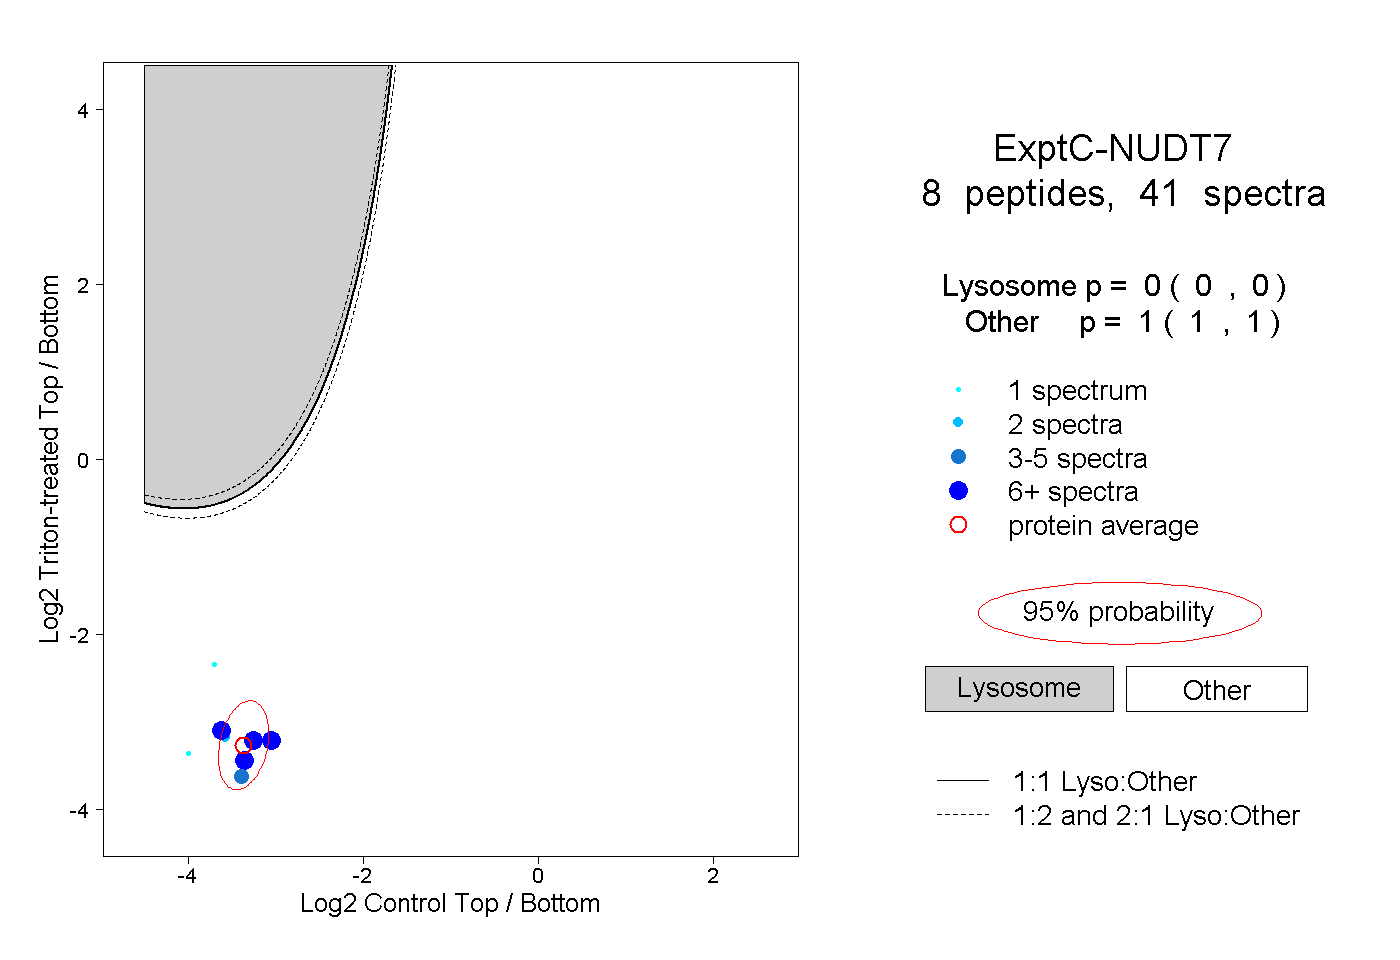 |
0.000 0.000 | 0.000 |
1.000 1.000 | 1.000 |
||||||||
| Plot | Lyso | Other | |||||||||||
| Expt D |
3 peptides |
5 spectra |
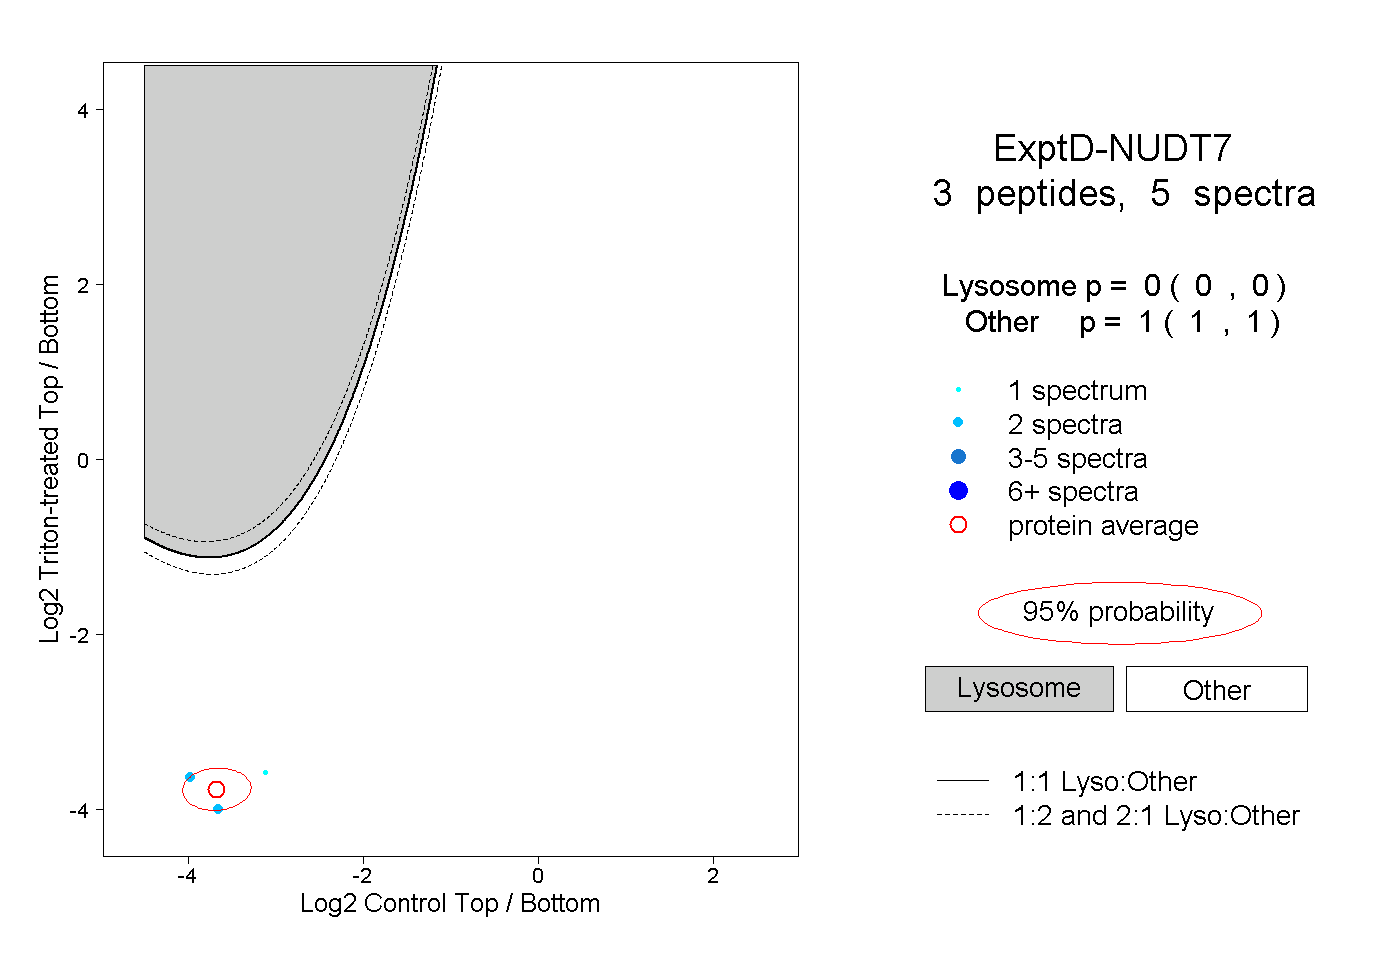 |
0.000 0.000 | 0.000 |
1.000 1.000 | 1.000 |